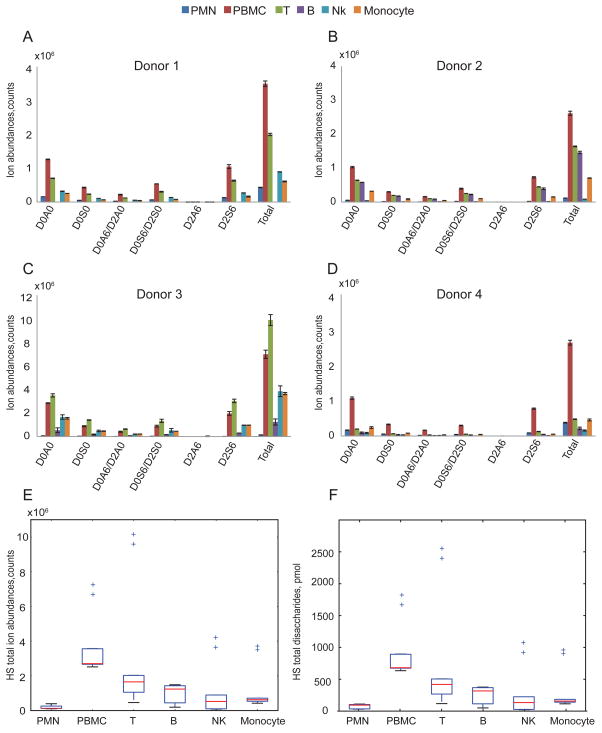
Figure 2.
Summary of ion abundances of HS Δ4,5-unsaturated disaccharides and total HS disaccharides from leukocytes from four donors. HS total ion abundance is the sum of six Δ4,5-unsaturated disaccharides ion abundances and is normalized to 10 million cells. The number of B cells isolated from donor 1(A) was too low that was below the limit of quantification. Triplicates samples of extracted GAGs were digested using heparin lyases I, II and III for donors 1(A), 2(B) and 4(D) for each cell population except B cells in which duplicates were used. Duplicates of extracted GAGs were digested with heparin lyases I, II and III for donor 3(C) for each cell population. Box-whisker plots of HS total disaccharides ion abundances in counts (E) and HS total disaccharides quantities in pmols (F), summarized from four donors. Box plot (E) shows that the median (range) for HS total disaccharides ion abundances in counts was 1.34*105 (1.16*105–3.94*105), 2.71*106 (2.52*106 –7.23*106), 1.65*106 (4.62*105–1.02*107), 1.24*106 (1.93*105–1.49*106), 5.26*105 (8.53*104–4.17*106) and 6.25*105(4.25*105 –7.16*106) for the PMN, PBMC, T, B, NK and monocyte, respectively. Box plot (F) shows that the median (range) for HS total disaccharides quantities in pmol was 94.03 (30.41–110.48), 680.80 (634.51–824.63), 418. 88 (117.81–2562.87), 316.50 (49.77–376.93), 133.69 (22.41–1078.462) and 157.34 (114.42–953.50) for the PMN, PBMC, T, B, NK and monocyte, respectively. The horizontal bar at the two ends represents the smallest and largest values. The values within the box are the first quartile (Q1), median and the third quartile (Q3). Outlier values are indicated using crosses, defined as 1.5(Q3-Q1) below Q1 or above Q3. The outliers in (E) and (F) represent values from donor 3 duplicates.

