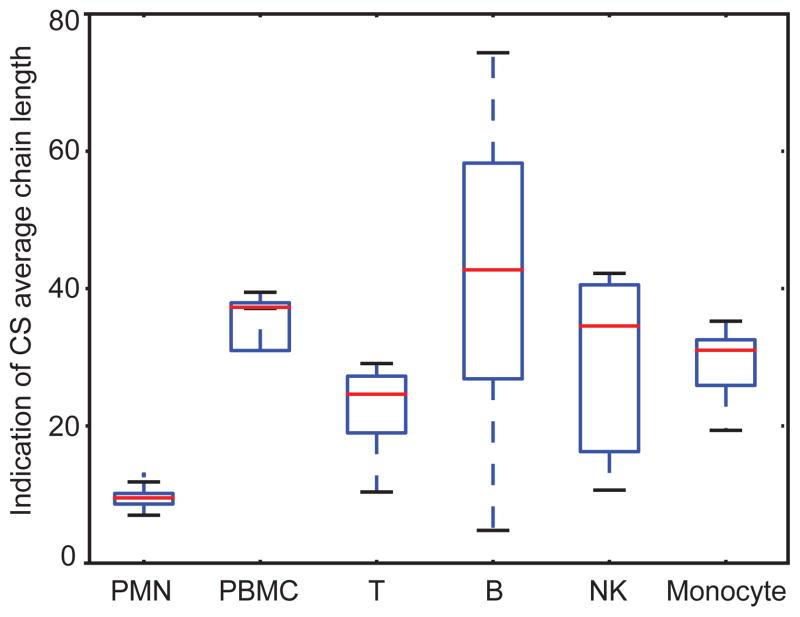
Figure 7.
Box-whisker plot comparing CS average chain length from leukocytes from four donors. The average chain lengths were calculated from the total CS saccharide ion abundance/(GalNAcSO3 and saturated disaccharides ion abundances). The median (ranges) were 9 (7–13), 37 (12–39), 24 (10–29), 43 (10–29), 35 (5–74), and 31 (11–42) for the PMN, PBMC, T, B, NK and monocyte, respectively. The box-whisker plot notation was the same as given in the Fig. 2 legend.

