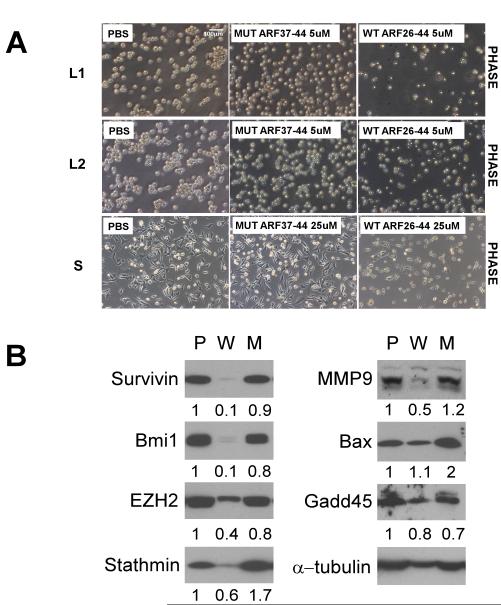
Figure 5. Cellular response of p53 null tumor cells following ARF 26-44 peptide treatment.
A, Phase contrast picture of CreERT2 Foxm1 fl/fl and p53 −/− thymic lymphoma and sarcoma cells treated with PBS, ARF 37-44 peptide (Mut) or ARF 26-44 peptide (WT) at 24 hours. B, Western blot of protein lysates extracted from thymic lymphoma cells treated with PBS, ARF 37-44 peptide (Mut) or ARF 26-44 peptide (WT). α–tubulin was used as a loading control. The band intensities were quantified by Image J program, and the relative intensities after adjusting for loading control (intensity of the tubulin bands) are shown below each panel.

