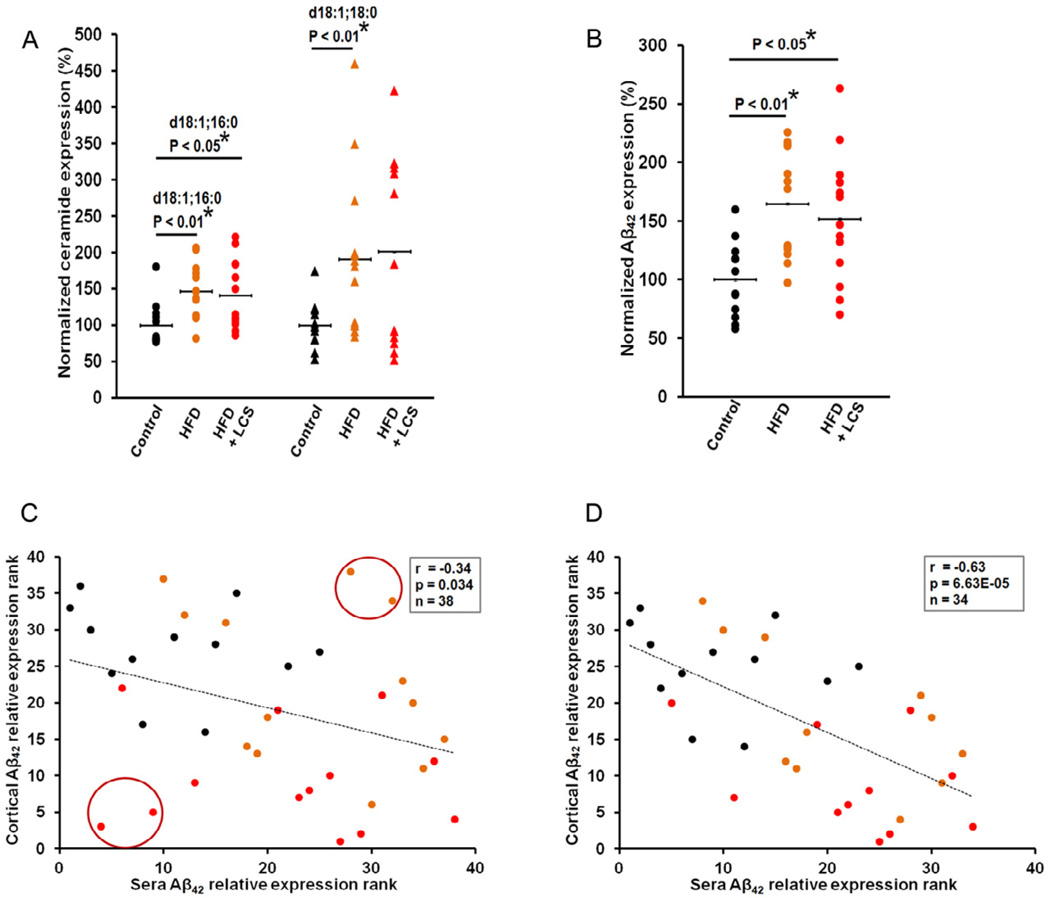
Figure 3. Sera Aβ correlates with cortical Aβ levels.
(A) Sera ceramide levels, d18:1; 16:0 and d18:1; 18:0, were statistically increased in high-fat (n=13) and, LCS administered mice (n=13) with the exception of d18:1; 18:0. The blood sera were analyzed via tandem mass spectrometry and the normalized concentrations are shown as a percentage of the average control (n=12). The samples were normalized to internal standard (d18:1, 12:0) concentration. (B) Aβ42 levels were significantly increased in high-fat (n=13) and LCS administered mice (n=13). The blood sera were analyzed with ELISA and the normalized concentrations are shown as a percentage of the average control (n=12). The statistical significances were determined by Mann-Whitney U tests. Spearman's correlation tests demonstrate a negative correlation between sera Aβ42 and cortical Aβ42 levels in the (C) entire sample set (n=38) and a statistically stronger significant negative correlation with the (D) elimination of 4 subjects as outliers (n=34). The statistical significance of the correlation was determined by two-tailed T distribution tests.

