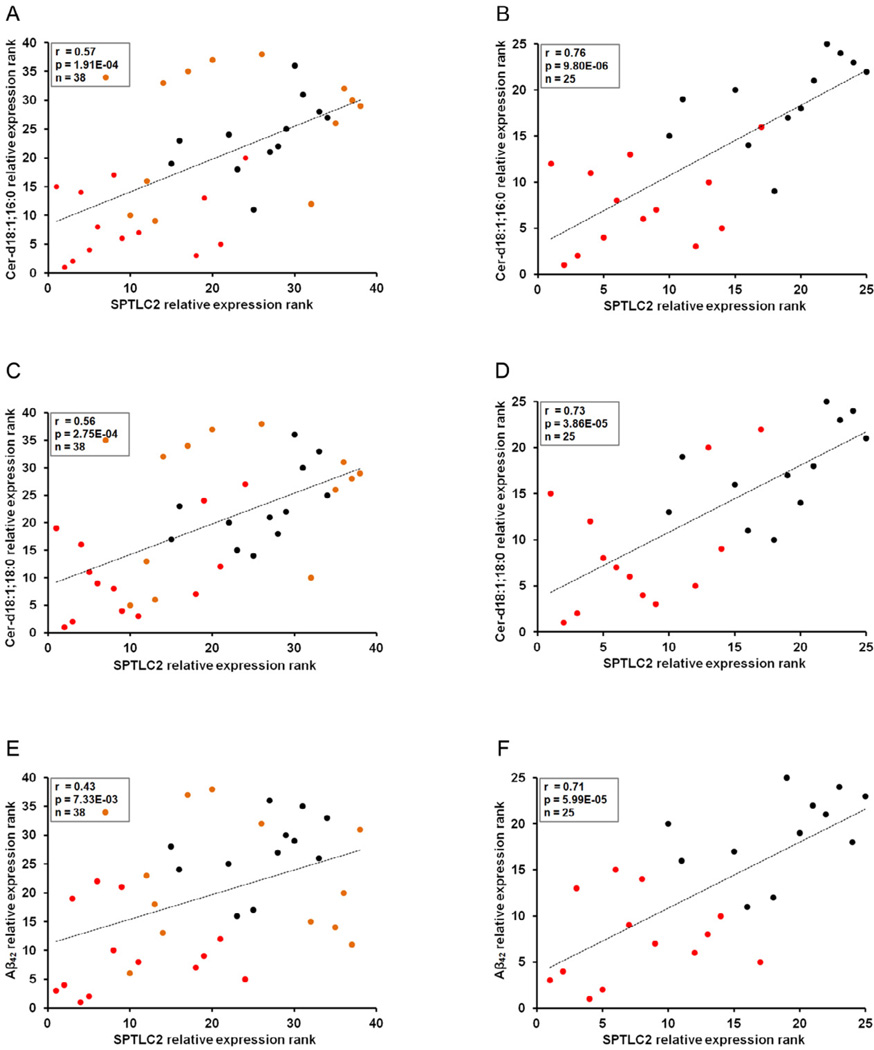
Figure 5. SPT expression correlates with ceramide and Aβ levels.
Spearman's correlation tests demonstrate significant positive correlation between cortical SPTLC2 protein levels and (A) cortical d18:1; 16:0, (C) d18:1; 18:0, and (E) Aβ42 levels in the entire sample set (control chow, high-fat, diets and LCS administration) (n=38). Stronger positive correlations are observed between cortical SPTLC2 protein levels and (B) cortical d18:1; 16:0, (D) d18:1; 18:0, and (F) Aβ42 levels in control chow diet and LCS administered mice (n=35). The statistical significance of the correlation was determined by two-tailed T distribution tests.

