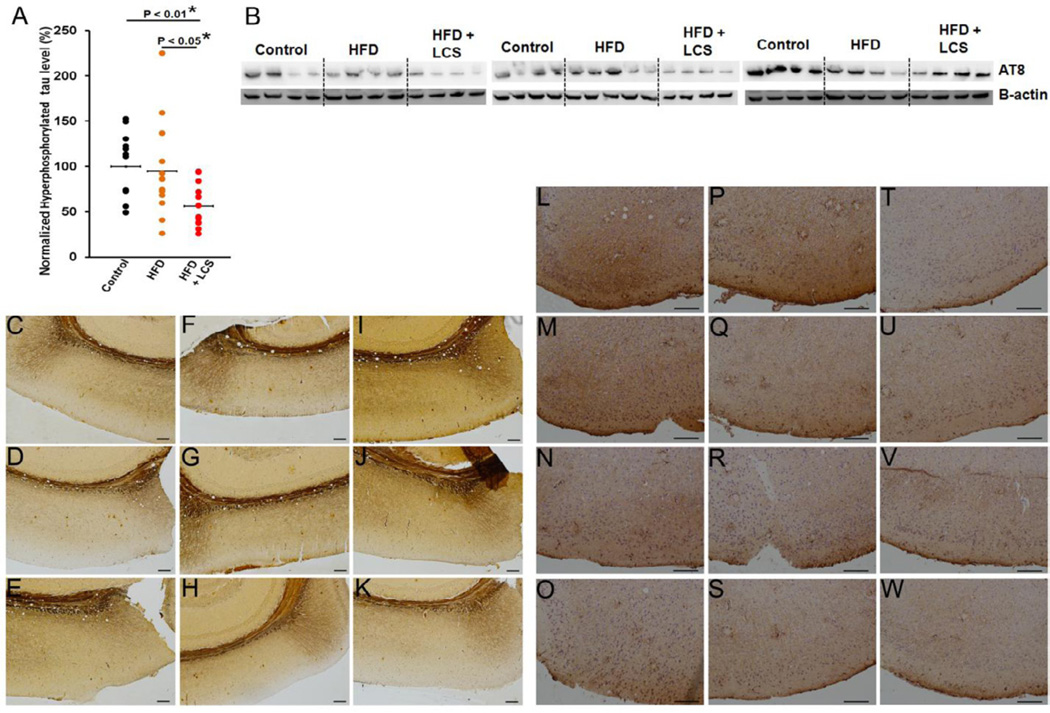
Figure 6. Tau hyperphosphorylation is down-regulated with LCS administration.
(A) Quantification and (B) representation of western blot for tau hyperphosphorylation (probed with AT8) in control chow (n=12), high-fat (n=13) and LCS administered (n=13) mice. The expression levels were quantified by normalizing to β-actin and represented as a percentage of the control chow mice average expression. The statistical significances were determined by Mann-Whitney U tests. The brain sections were stained for Beilschowsky’s silver staining and captured with the camera on bright-field at 10× at the location denoted in red in Fig. 2C for (C–E) control chow, (F–H) high-fat and (I–K) LCS administration. The brain sections were stained with NF200 antibody and were captured with the camera on bright-field at 20× at the location denominated in red in Fig. 2C for (L–O) control chow, (P–S) high-fat and (T–W) LCS administration.

