Fig. 1.
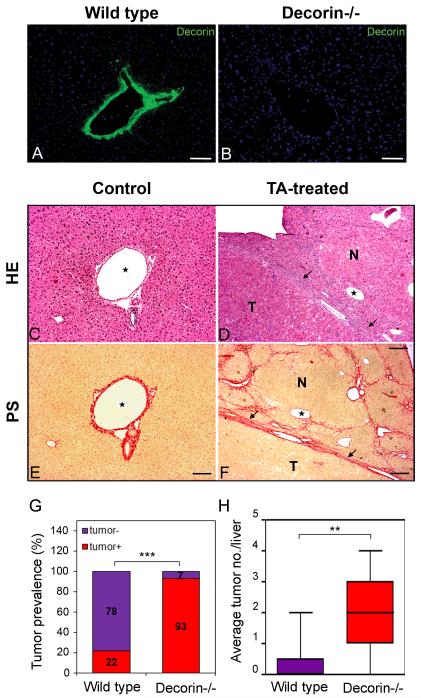
Decorin immunostaining and morphology of TA-induced liver tumors and tumor prevalence. Immunostaining for decorin in representative liver samples from wild-type control (A) and decorin-deficient control (B) mice. Nuclei are counterstained with DAPI (blue). Scale bar = 100 μm. Representative pictures of hematoxylin-eosin stained normal (C) and tumor bearing livers (D) induced by thioacetamide. Connective tissue-specific picrosirius staining on untreated control livers (E) and livers with hepatocellular carcinoma (F). TA=thioacetamide treatment. HE=hematoxilin-eosin staining. PS=picrosirius staining specific for connective tissue. N=nodule, T=tumor. Arrows point at tumor borders. Asterisks show the same vein on HE and PS-stained sections. Scale bars=100 μm. (G): diagrams show the ratio of tumor-bearing mice in experimental groups of wild type (Wt) and decorin knock out (Dcn−/−) mice. n=12, ***P<0.001 assessed by χ2-test. (H): columns represent the average tumor count per liver in livers exposed to TA. n=12, ** P <0.01.

