
Figure 4.
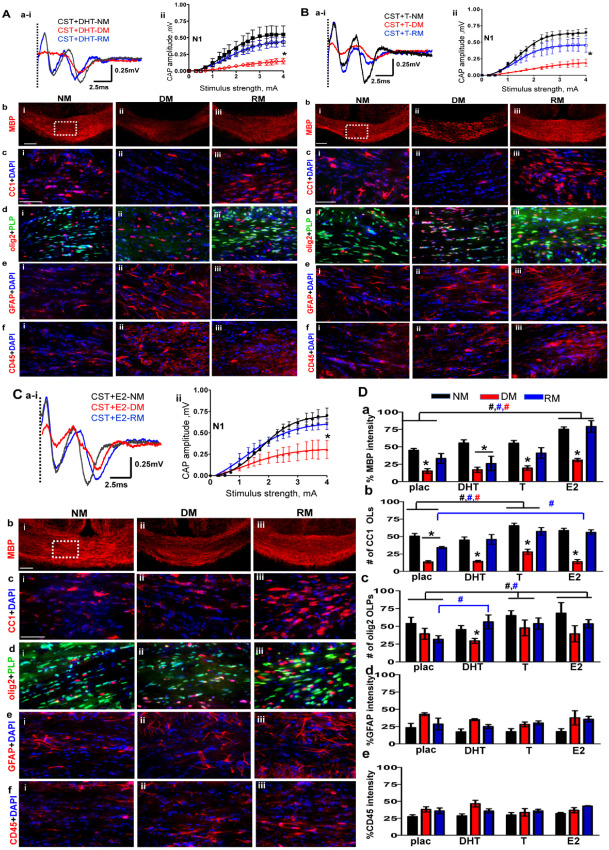
A. Non‐aromatizing hormone dihydrotestosterone (DHT) supplementation in castrated (CST) males does not affect normal myelination, demyelination or remyelination. (ai–ii) CAP responses for DHT‐administered CST males under NM (black), DM (red) and RM (blue) condition. Representative traces for CAP response to 4.0 mA stimulus induced a small increase in N1 peak amplitude during NM and RM condition as compared to placebo‐treated CST animals. N1 amplitude was significantly attenuated during DM in CST + DHT similar to CST + placebo groups. Quantification of N1 CAP amplitudes reveals small but significant increase in N1 peak amplitudes during NM and RM compared to CST + placebo mice. (bi–iii) MBP (red) immunostaining during NM, DM and RM in the CST + DHT group showed a significant decrease during DM and an increase during RM, but these changes were similar to those seen in the CST + placebo group. (ci–iii) Consecutive brain sections were immunostained and imaged at 40× magnification from various groups in an area similar to that of the dashed square in bi. During DM condition, a significant decrease and during RM, a significant recovery in CC1+ OLs‐red counterstained with DAPI‐blue was observed in both CST + DHT and CST + placebo groups. (di–iii) CST + DHT group showed an increase in OLPs (PLP_EGFP‐green + olig2‐red) during RM condition as compared to CST + placebo group. (ei–iii, fi–iii) GFAP+ astrocyte (red) and CD45+ microglia (red) counterstained with DAPI (blue) showed similar fluorescence intensity increases in DM and RM condition and were similar to CST + placebo mice (*P < 0.05; n = 10). B. Hormone replacement with testosterone (T) partially reverses oligodendrocyte cell loss and callosal conduction associated with demyelination and accelerates recovery during remyelination of CST males. (ai,ii) CAP responses for T‐administered CST males under NM (black), DM (red) and RM (blue) conditions. Representative traces for CAP response to 4.0 mA stimulus induced a significant increase in N1 peak amplitude during NM and RM condition as compared to placebo‐treated CST animals. Quantification of N1 CAP amplitudes reveals a significant increase in N1 peak amplitudes of T‐administered group under NM and RM condition as compared to CST + placebo males. N1 amplitude was significantly attenuated during DM in CST + T similar to CST + placebo groups. (bi–iii) MBP immunostaining intensity in CST + T mice was significantly decreased during DM but recovered during RM condition similar to CST + placebo mice. (ci–iii) Consecutive brain sections were immunostained and imaged at 40× magnification from various groups in an area similar to that of the dashed square in bi. A significant increase in OLs (CC1‐red+DAPI‐blue) under NM, DM and RM in the CST + T group was observed. The number of OLs was significantly increased as compared to CST + placebo group. (di–iii) There was a significant increase in OLPs (PLP_EGFP‐green + olig2‐red) in CST + E2 group under NM, DM and RM conditions as compared to CST + placebo mice. (ei–iii, fi–iii) GFAP+ astrocytes (red) and CD45+ microglia (red) counterstained for nuclei with DAPI (blue) showed similar increases in fluorescence intensity during DM and RM conditions similar to CST + placebo mice (*P < 0.05; n = 8). C. Hormone replacement with estradiol (E2) partially reverses OL cell loss associated with demyelination and accelerates recovery during remyelination of CST males. (ai–ii) CAP responses for E2‐administered CST males under NM (black), DM (red) and RM (blue) condition. Representative traces for CAP response to 4.0 mA stimulus induced a significant increase in N1 peak amplitude during NM and RM condition as compared to placebo‐treated CST animals. N1 amplitude was significantly attenuated during DM in CST + E2 similar to CST + placebo groups. Quantification of N1 CAP amplitudes reveals a significant increase in N1 peak amplitudes of E2‐administered group under NM, DM and RM condition as compared to CST + placebo males. (bi–iii) MBP (red) immunostaining intensity was significantly increased for CST + E2 under NM, DM and RM condition as compared to CST + placebo. (ci–iii) OLs stained with CC1 (red) and counterstained with DAPI (blue) showed significant cell loss during DM and significant recovery during RM. CST + E2 group had a significant increase in CC1+ OLs under NM and RM condition as compared to CST + placebo group. (di–iii) There was a significant increase in olig2+ OLPs (PLP_EGFP‐green + olig2‐red) with E2 supplementation under NM, DM and RM condition as compared to CST + placebo groups. (ei–iii) GFAP+ astrocytes (red) and CD45+ microglia (red) showed increased staining intensity under DM and RM condition that was similar to CST + placebo mice. (*P < 0.05; n = 8). D. Summary of results of (from left to right) placebo‐, DHT‐, T‐ and E2‐ pellet implanted castrated animals during normal myelination, demyelination and remyelination. (a) MBP fluorescence intensity showing similar decreases during DM and increases during RM conditions within placebo‐, DHT‐, T‐ and E2‐supplemented CST groups. E2 supplement was the only hormone to increase fluorescence intensity significantly for NM, DM and RM condition in CST + E2 as compared to CST + placebo. E2 supplementation circumvents the negative aspect of castration on MBP staining intensity under all conditions. (b) More so, under RM conditions, CC1+ OL cell count per area was increased in T‐ and E2‐implanted but not DHT‐implanted castrated animals. (c) Similarly, under RM conditions, olig2+ OLPs showed a significant increase in cell count per area under all hormone replacement paradigms as compared to CST + placebo. Moreover, T and E2 supplement supported elevated OLP and OL cell counts during NM, pointing to a direct hormonal role in OLP proliferation. (d,e) GFAP fluorescence intensity and CD45 fluorescence intensity, normalized to 100%, shows equal reactivity and did not change with hormone replacement (t‐test *P < 0.05 n = 8–12; ANOVA, #P < 0.5, n = 6–8; colors represent significance for NM, DM or RM).