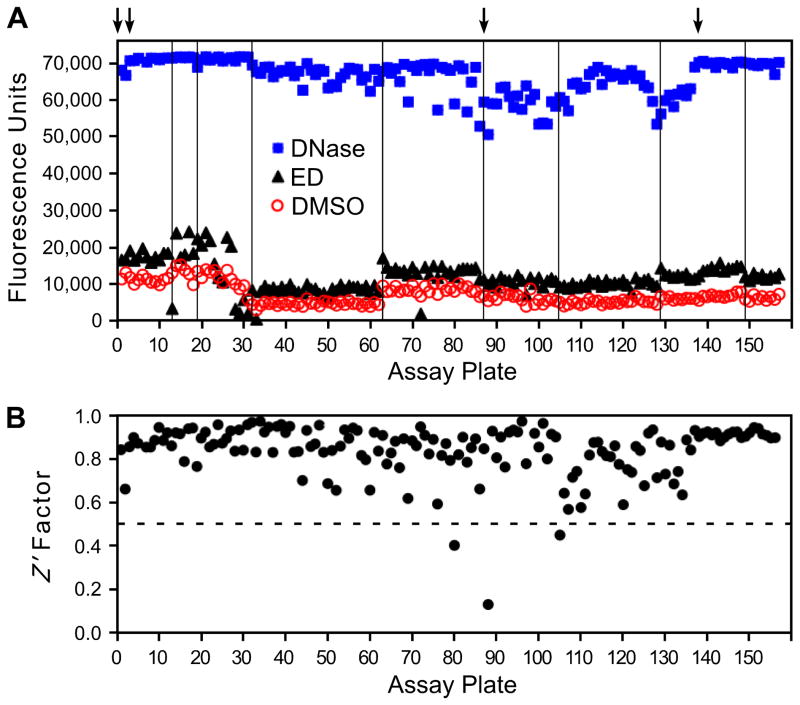
Figure 2. Quality control data from screening the full library.
The 50,080 chemicals in the library were tested on 157 plates. Panel A shows the mean values from each plate for reactions with integrase and DMSO (the negative control for baseline nicking, circles), reactions with integrase and ED (an example of a known stimulator, triangles), and reactions to which DNase I was added (the positive control for extensive nicking, squares). The arrows at the top indicate the use of new lots of the double-tagged oligonucleotide substrate, and the vertical lines denote the use of new preparations of purified integrase. Panel B shows the calculated Z′ factor for each plate. The dashed line is drawn at 0.5, and values above this level are considered optimal for high-throughput screening.

