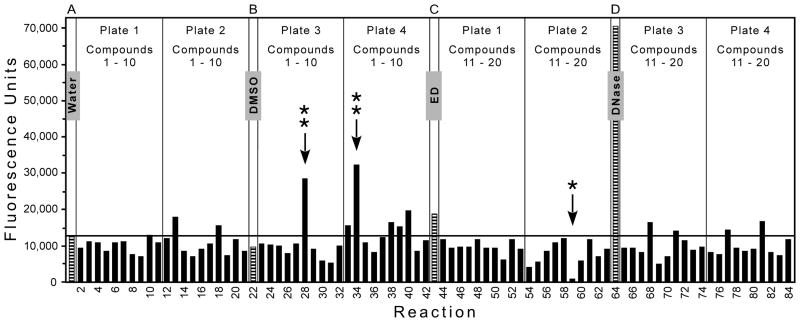
Figure 3. Example of output from the assay.
Each 384-well assay plate included 336 reactions (320 test chemicals plus 16 controls) using all 16 rows and 21 of the 24 columns. Each assay plate was processed as in the Methods to yield 4 bar graphs; an example of 1 graph is shown (slightly modified so that all 4 types of controls appear in this figure). Each graph presents data from 4 rows (A, B, C, D in this example) of 21 reactions. Each set of 21 reactions includes 1 control (the striped bar, representing a reaction with water or DMSO as negative controls, ED as a known stimulator, or DNase I as positive control for extensive nicking) plus 10 compounds (the solid bars) from each of 2 source plates from the library (Plates 1, 2, 3, 4 in this example, as demarcated by vertical lines). The horizontal line marks the mean + 3 SD for the DMSO negative controls. Of 80 reactions with test chemicals, the arrows indicate 2 with markedly increased fluorescence (**, primary hits) and 1 with greatly diminished signal (*).

