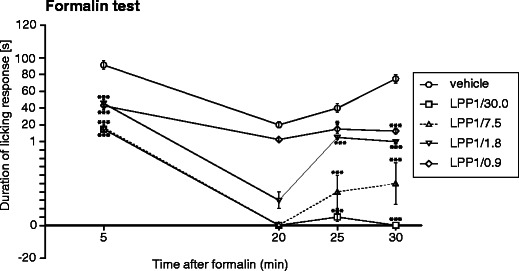
Fig. 1.

Time course of the antinociceptive activity of LPP1 in the formalin test. Data are shown as mean duration of the licking response (±SEM) measured at selected intervals: 0–5 min, 15–20 min, 20–25 min, and 25–30 min. Statistical analysis of the results was conducted using two-way repeated measures ANOVA, followed by Bonferroni's multiple comparison. Drug effect: F[4,105] = 32.57; p < 0.0001; time effect: F[3,105] = 38.55; p < 0.0001; interaction: F[12,105] = 4.53; p < 0.0001. Results compared to vehicle-treated mice at the same time points: *p < 0.05; ***p < 0.001
