
Figure 1.
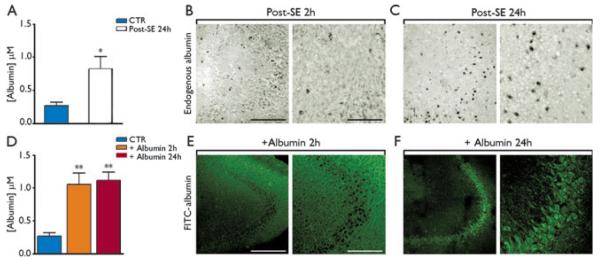
Hippocampal levels and tissue distribution of rat serum albumin after induction of status epilepticus (SE) (A–C), and comparison with rat albumin injection in naive rats (D–F). Panel A depicts the levels of rat serum albumin attained in the hippocampus 24 h after SE induction in rats (n = 7 each group). Panels B and C are representative pictures of the CA3 area at low- and high-magnification depicting rat serum albumin distribution in the brain parenchyma. Albumin signal was predominantly extracellular 2 h after SE (B), whereas at 24 h albumin staining was observed in CA3 pyramidal neurons (C). Panel D shows albumin concentrations attained in the rat hippocampus 2 and 24 h after i.c.v. injection of 500 μg/4 μl rat albumin (n = 4 rats each exp group). Panels E, F depict the hippocampal distribution of FITC-albumin (500 μg/4 μl, i.c.v.) denoting its extracellular accumulation 2 h after the injection and its intraneuronal signal in CA3 pyramidal neurons 24 h after the injection. Data in bar grams are mean ± standard error. *p < 0.05; **p < 0.01 versus CTR (vehicle-injected rats in panel A or dextran-injected rats in panel D) by Mann-Whitney U test for two independent groups (A) or by Kruskal-Wallis one-way analysis of variance followed by Dunn’s multiple comparison test (D). Scale bar 100 μm (low magnification), 25 μm (high magnification).
Epilepsia © ILAE