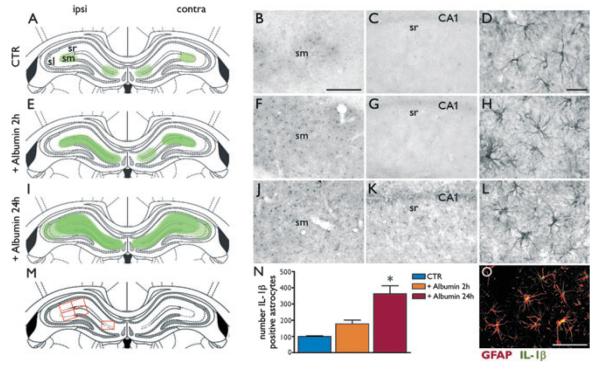
Figure 2.
Astrocytes activation and IL-1β induction after rat albumin injection in naive rats. Panels A, E, I (first column) depict a schematic representation of the area of distribution of IL-1β positive cells in the hippocampus proper after albumin injection (E, I) as compared to dextran-injected rats (A). Panels B, C depict IL-1β staining in the hippocampus of dextran-injected rats (CTR) denoting virtual lack (C) or barely detectable (B) signal. Panels F, J depict the increase of IL-1β in cells with glia morphology in stratum moleculare (sm) of the hippocampus 2 h (F) and 24 h (J) after rat albumin injection (500 μg/4 μl, i.c.v., coordinates of injection are reported in Methods section). Increases were also observed in stratum radiatum (sr, K) and lucidum (sl, not shown, see panel I) 24 h, but not 2 h (G, E) after albumin. Panel D shows a high magnification picture of resting state GFAP-astrocytes in dextran-injected hippocampus. Panels H and L depict GFAP-positive astrocytes with morphologic features of activation 2 and 24 h postinjection, respectively. Panel O depicts colocalization of IL-1β with GFAP in the stratum moleculare of hippocampus of albumin-injected rats. Scale bar 50 μm (B, C, F, G, J, K), 25 μm (O), 10 μm (D, H, L). Panel N depicts the total number of IL-1β positive cells (mean ± standard error, n = 4–6 rats each group) counted after albumin versus dextran (CTR) injection in the areas depicted by red boxes in panel M. p < 0.05 versus CTR by Kruskal-Wallis one-way analysis of variance followed by Dunn’s multiple comparison test. Ipsi and contra refer to the hippocampus ipsilateral or contralateral, respectively, to the injected ventricle.
Epilepsia © ILAE

