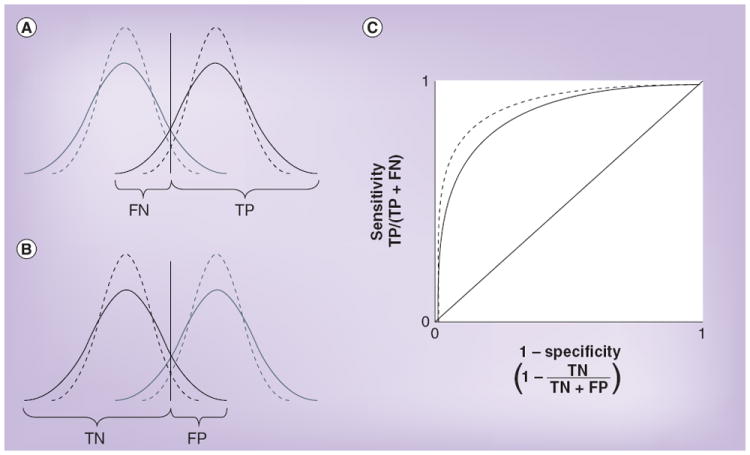
Figure 2. Effect of analytical imprecision on the calculation of sensitivity and specificity.

(A & B) The dotted lines represent the true distributions of concentrations, the solid lines represent the distributions that are observed as a consequence of both true variation and analytical imprecision, and the vertical lines show the cut-off points used to distinguish a positive from a negative test result. (A) Analytical imprecision increases the FN rate and correspondingly reduces the TP rate, thereby reducing sensitivity. (B) Analytical imprecision increases the FP rate and correspondingly reduces the TN rate, thereby reducing specificity. (C) The effect on a receiver operating characteristic curve. FN: False negative; FP: False positive; TN: True negative; TP: True positive.
