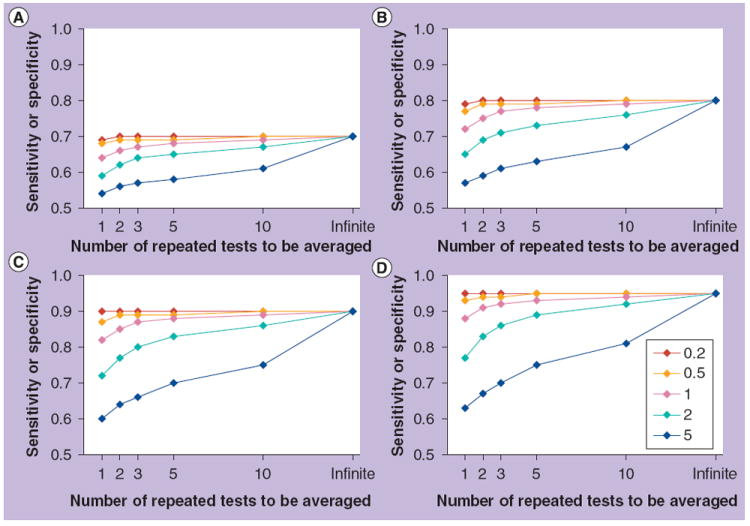
Figure 3. Effect of the index of individuality on sensitivity or specificity.

In each panel, five lines show the observed reduction in sensitivity or specificity at different indices of individuality, which is the ratio of analytical imprecision and within-subject variation to between-subject variation. Improvements obtained by averaging different numbers of results are shown. (A–D) indicate true sensitivities/specificities of (A) 0.7, (B) 0.8, (C) 0.9 and (D) 0.95. As discussed in the text, for laboratory tests in common use, indices of individuality are usually 0.5–1.0 and rarely greater than 1.4.
