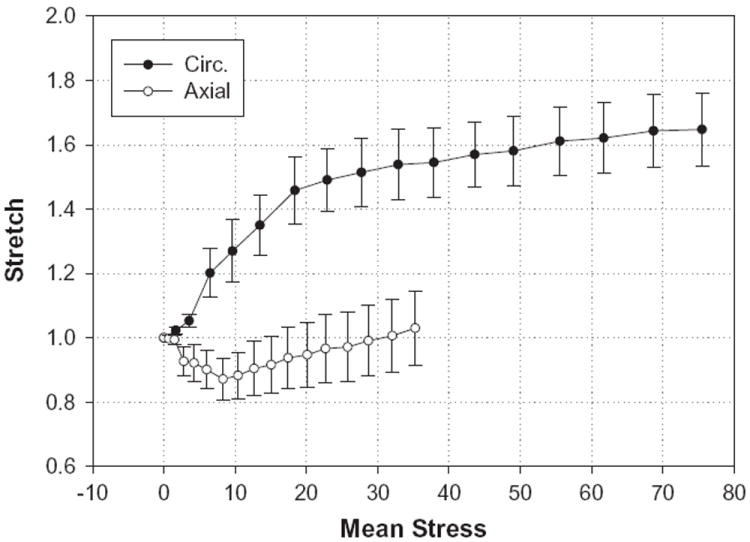
Fig. 7.

Stretch–stress curves for the CS obtained from the pressure–inflation tests. The upper curve represents the response in the circumferential (Circ.) direction, while the lower curve is for the axial direction. Data are expressed as means ± standard error.
