
Fig. 9.
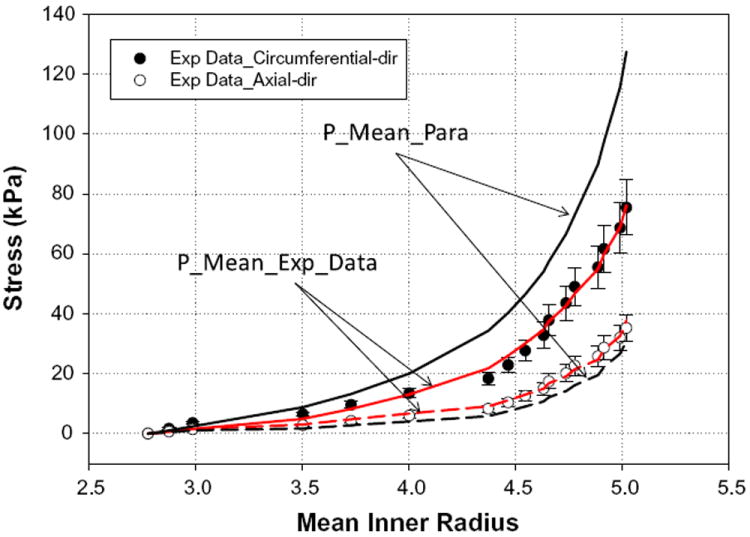
Fits of the mean experimental data for all seven specimens (P_Mean_-Exp_Data) and mean parameters obtained from averaging individual parameters (P_Mean_Para). Solid lines are the circumferential fits, while long dashed lines represent the axial fits. Fitting of the results shows that the parameters obtained from averaging the experimental data (P_Mean_Exp_Data) provided a better fit. Data are expressed as means ± standard error.