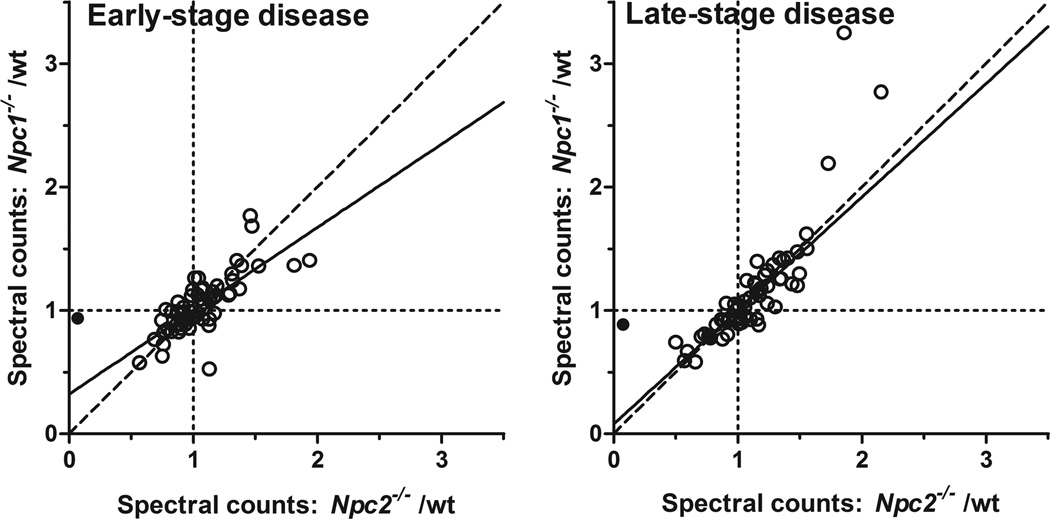
Figure 2. Spectral counts for NPC1 and NPC2 mutants normalized to controls in early and late-stage disease.
Data represent known lysosomal proteins and potential candidates with an average of at least 10 spectral counts per animal. The filled symbol represents NPC2 which we expect to be essentially absent from the Npc2−/− animals. Data are fit to a first order polynomial using the robust fit option in Graphpad Prism 5 (solid line). Dashed line represents x=y; dotted lines, x=1 and y=1.

