
Table 1.
Comparative evaluation of glycated hemoglobin levels (HbA1c) in the test and control groups.
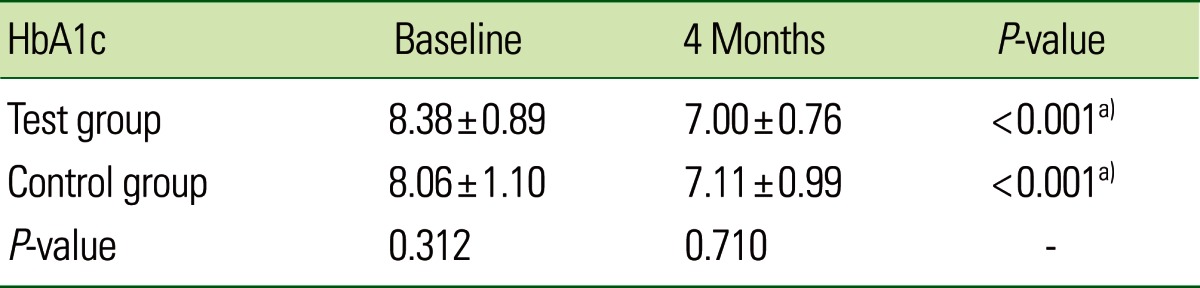
Values are presented as mean±standard deviation.
a)Strongly significant (P≤0.01).
Official websites use .gov
A
.gov website belongs to an official
government organization in the United States.
Secure .gov websites use HTTPS
A lock (
) or https:// means you've safely
connected to the .gov website. Share sensitive
information only on official, secure websites.
Comparative evaluation of glycated hemoglobin levels (HbA1c) in the test and control groups.
Values are presented as mean±standard deviation.
a)Strongly significant (P≤0.01).