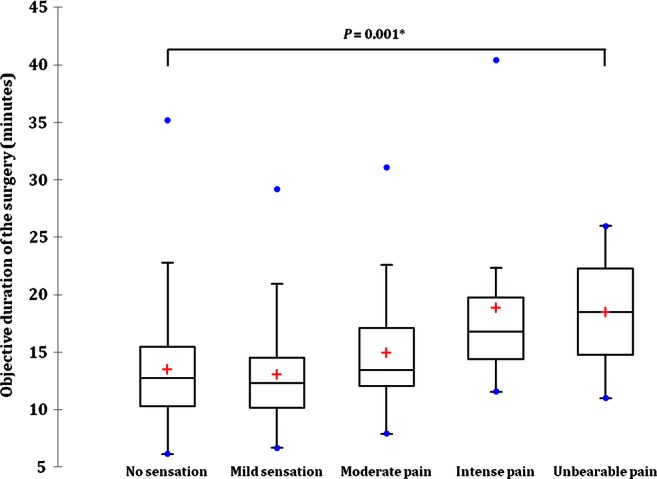
Figure 3.

Objective surgery duration according to the pain score group. The bar in the box indicates the median, the cross the mean and the lower and upper hinge the IQR. The whisker extends to the most extreme data point which is no more than 1.5 times the IQR. Dots represent values outside the fences (outliers).*Kruskal-Wallis test.
