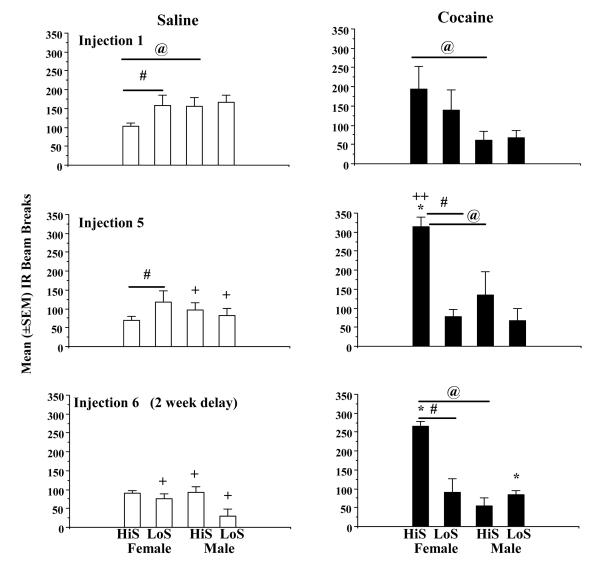
Fig. 1.
Locomotor activity during 45-min sessions for LoS F (n=6), HiS F (n=6), LoS M (n=6), and HiS M (n=6) rats following saline (left frames, open bars), then cocaine (10 mg/kg, i.p.) (right frames, filled bars) injections 1, 5, and 6 (2 week delay). Data represent the mean (±SEM) number of infrared (IR) beam breaks (positioned every 90° in a circular locomotor track). Asterisks represent significant within-group (locomotor stimulant effects saline vs. cocaine differences) at p<0.05. Horizontal bars with a pound sign represent a significant phenotype (HiS vs. LoS) differences at p<0.05. @ signs represent significant sex differences (F>M or M>F at p<0.05). A + sign represents a significant (p<0.05) decrease in locomotor activity relative to saline injection 1, evidence of a novelty effect after the first saline injection and exposure to the locomotor track. A double plus sign (++) indicates a significant (p<0.05) increase in cocaine-induced locomotor activity, evidence of a sensitization effect.

