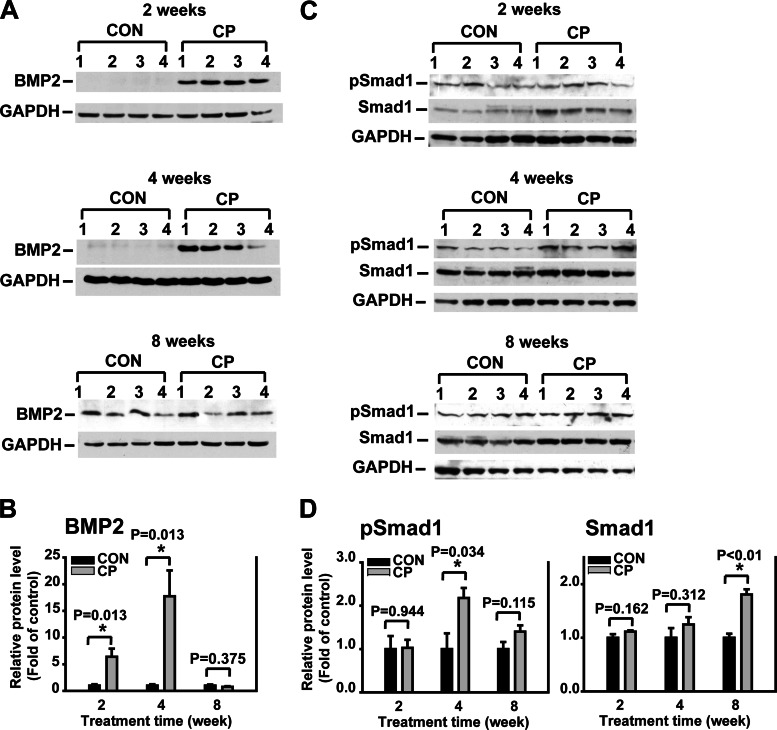
Fig. 4.
Bone morphogenetic protein (BMP) 2 and phosphorylated Smad1 (pSmad1) levels in the pancreas during progression of CP. A: Western blotting of pancreas tissue lysates from CON and CP mice using BMP2 antibodies. B: quantification of BMP2. The protein levels were normalized against GAPDH and quantified as fold of control. C: Western blotting of pancreas tissue lysates from CON and CP mice using pSmad1 and total Smad1 antibodies on the same blots. D: quantification of pSmad1 and total Smad1. The protein levels were normalized against GAPDH and quantified as fold of control. *P < 0.05 compared with control; n = 4 mice/group.

