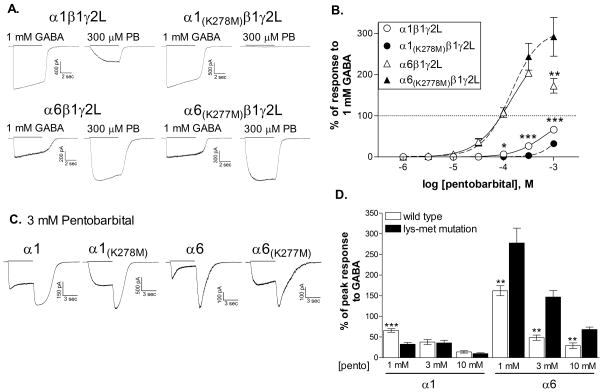
Figure 3. Direct activation by pentobarbital is reduced by the mutation of the α1 subunit but not of the α6 subunit.
A. Representative whole-cell traces in response to a 5 sec applications (solid line) of 300 μM pentobarbital or 1 mM GABA at a membrane potential of −50 mV. Traces were obtained from the same cell for each subunit combination.
B. Concentration-response relationships were constructed by dividing the peak response to each concentration of pentobarbital by the response to 1 mM GABA for each cell. The maximum response to GABA (100%) is indicated by the dotted line. Points shown are the mean ± SEM. Averaged data were fit with a four-parameter logistic equation represented by the solid (wild type) or dashed (mutated) line. Because of the onset of inhibition, the response to 1 mM pentobarbital was not included in the fit for the wild-type α6β3γ2L isoform. EC50s for the fits shown are 630.9 μM (α1β1γ2L, N=7), 1.69 mM (α1(K278M)β1γ2L, N=6), 143.9 μM (α6β1γ2L, N=6) and 140.2 μM (α6(K277M)β1γ2L, N=6). *(p≤0.05) or ***(p≤0.001) indicate a significant difference between the wild-type and mutated counterparts (unpaired, 2-tailed t-test).
C. Whole-cell traces in response to a 5 sec applications (solid line) of 3 mM pentobarbital at a membrane potential of −50 mV. Rebound current following the removal of applied drug is characteristic of rapid open channel block.
D. The peak current response during pentobarbital application was measured. Symbols and bars represent the average ± SEM. Data from 5–10 cells for each concentration **(p≤0.01) or ***(p≤0.001) indicate a significant difference from the mutated counterpart (unpaired, 2-tailed t-test).

