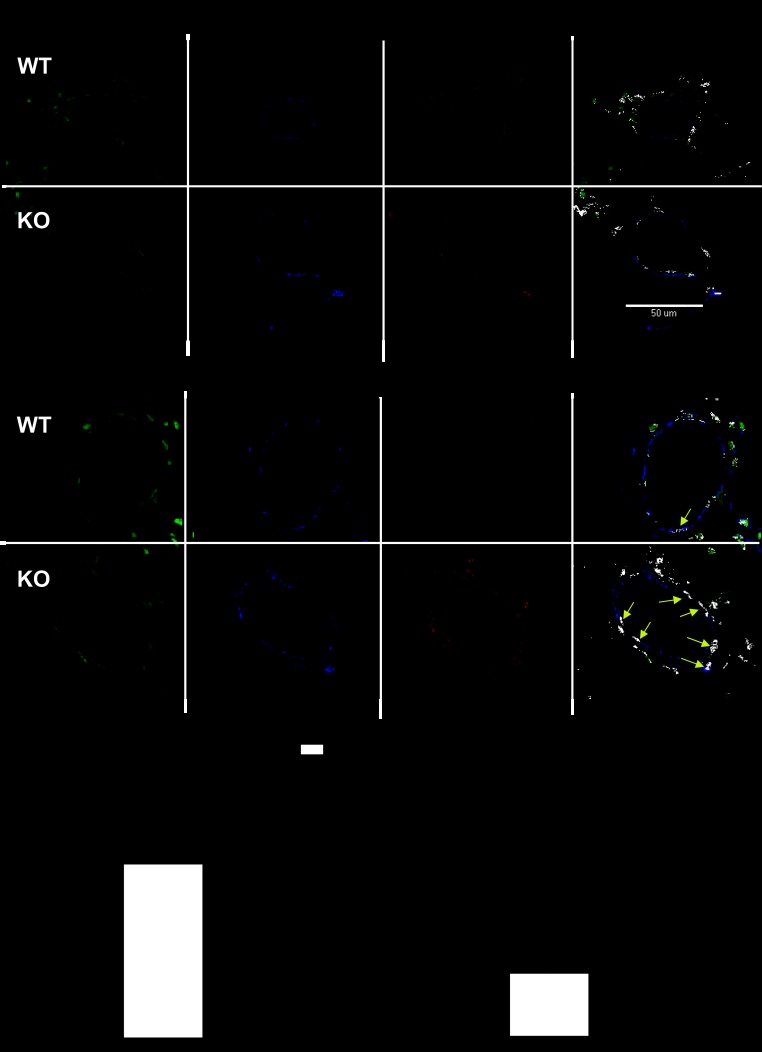
Fig. 4.
NFATc3 but not NFATc2 is activated in PASMC from SOD1 KO mice. A: representative images of immunofluorescence confocal detection of NFATc2 and NFATc3 nuclear localization in PASMC of WT and SOD1 KO mice. Nuclei are shown in green, smooth muscle α-actin is shown in blue, and NFATc2 or NFATc3 in red. NFAT nuclear localization is shown in white in the overlay image. Yellow arrow depicts a PASMC nucleus with NFATc3 nuclear localization (positive). *P < 0.05 vs. WT. (n = 4 mice; average of 100–150 cells/mouse). Scale bar = 50 μm.

