
Fig. 1.
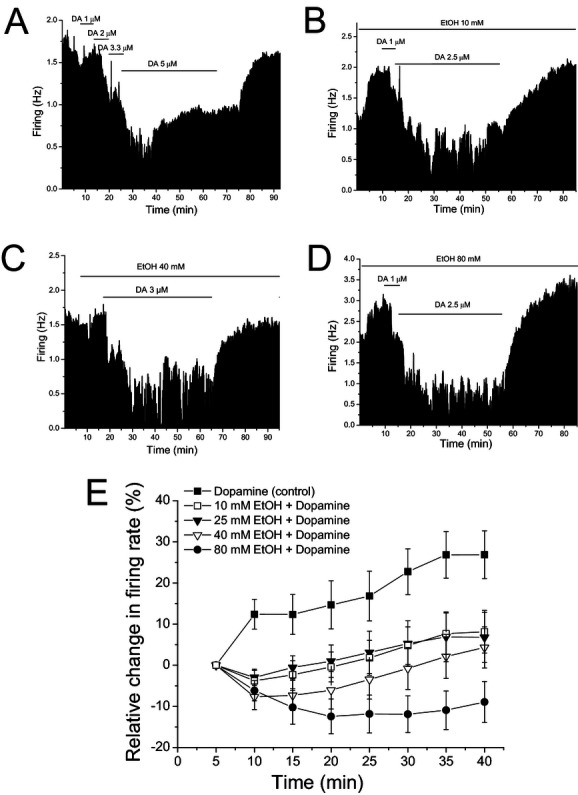
Ethanol (EtOH) prevents dopamine (DA) inhibition reversal (A–D). Mean ratemeter graphs of the effects of a 40-minute DA application under different conditions on 4 different pDAergic ventral tegmental area neurons. Vertical bars indicate the firing rate over 5-second intervals. Horizontal bars indicate the duration of drug application (concentrations indicated above bar). (A) DA concentration was increased in a stepwise fashion until >50% inhibition was achieved, and then, that concentration was applied for a total of 40 minutes. Over time, the DA-induced inhibition decreased. (B) In the presence of 10 mM EtOH, there was no obvious reduction in the effect of DA applied for 40 minutes until the last 10 minutes. (C) In the presence of 40 mM EtOH, no obvious decrease in the effect of DA over the 40-minute application period was observed. (D) In the presence of 80 mM EtOH, there was a slight increase in the DA-induced inhibition over the 40-minute time period of DA application. (E) Pooled time course graph for the cells tested for DIR in the absence of (▪, control, [DA] = 5.5 ± 1.0 μM, n = 25) or in the presence of EtOH (10 (□, [DA] = 5.8 ± 0.6 μM, n = 28), 25 (▼, [DA] = 5.4 ± 0.8 μM, n = 24), 40 (∇, [DA] = 5.0 ± 0.7 μM, n = 20), and 80 (•, [DA] = 5.0 ± 0.9 μM, n = 15) mM). Time indicated on the abscissa reflects time relative to the initiation of DA administration.