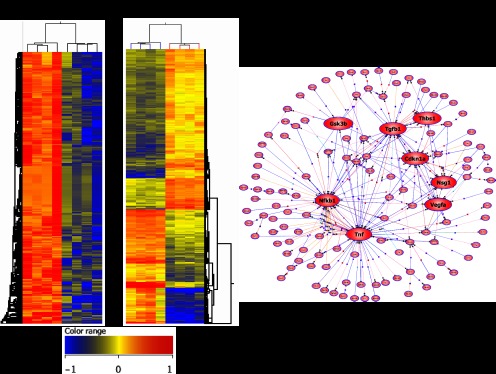
Fig. 7.

Heatmap and pathway analysis. A: heatmap at 1 and 3 mo comparing PI with sham-operated controls. 372 genes were downregulated by >2-fold at 1 mo. Corrected P value <0.05. At 3 mo 434 genes were upregulated and 307 were downregulated by >2-fold. Corrected P value <0.05. B: pathway analysis at 3 mo after PI demonstrated key nodal points highlighted here in red including upregulation in transforming growth factor-β1 (TGF-β1), thrombospondin, and TNF signaling and downregulation in NF-κB1 signaling.
