
Fig. 3.
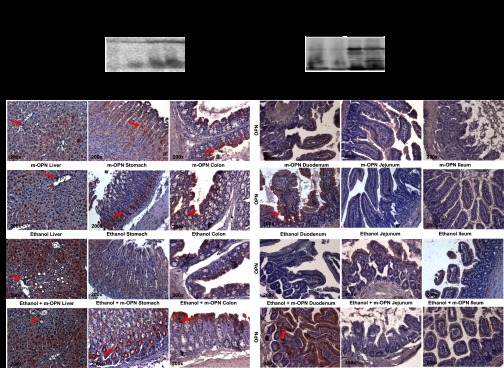
OPN expression enhances in plasma, feces, liver, stomach, colon, and duodenum. WT mice were fed 3 wk either the control or the alcohol Lieber-DeCarli diet alone or in combination with 200 μg/ml m-OPN. Western blot analysis from plasma (left) and feces (right) showed increased cleaved, full, and polymeric OPN expression in m-OPN-cotreated mice (A). There was an increase in endogenous hepatic OPN expression by ethanol treatment, with significant expression in cholangiocytes (red arrows) and hepatocytes (diffuse pattern) (B, left). There were abundant OPN+ cells (red arrows) in the stomach (B, center), colon (B, right), and duodenum (C, left) from both groups of m-OPN-treated mice. PV, portal vein. n = 6. ●P < 0.05 and ●●P < 0.01 for m-OPN treated vs. its own control.