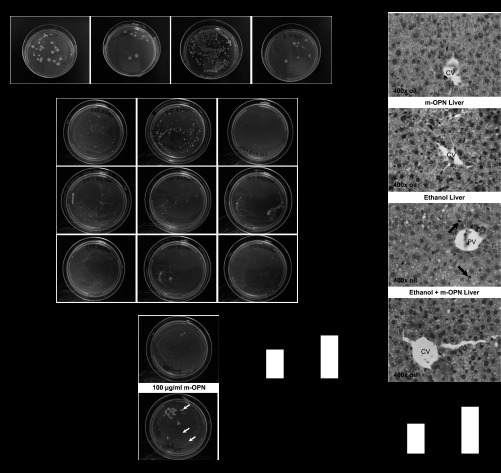
Fig. 6.
Hepatic and gut bacterial growth and tumor necrosis factor-α (TNF-α) expression decrease by m-OPN in cotreated mice. WT mice were fed 3 wk either the control or the alcohol Lieber-DeCarli diet alone or in combination with 200 μg/ml m-OPN. A: bacterial growth in crushed livers cultured in LB-Agar plates. B: bacterial growth in crushed colons, ileums and jejunums cultured in LB-Agar plates. EtOH, ethanol. C: enteric bacteria cultured in the presence or absence of m-OPN. D: liver lipopolysaccharide (LPS). E: TNF-α IHC depicts greater TNF-α+ sinusoidal cells (black arrows) in alcohol-treated than in m-OPN co-treated mice. CV, central vein. F: TNF-α morphometric analysis. n = 6; *P < 0.05 for any alcohol-treated group vs. its own control. ●●P < 0.01 for any m-OPN treated vs. its own control.

