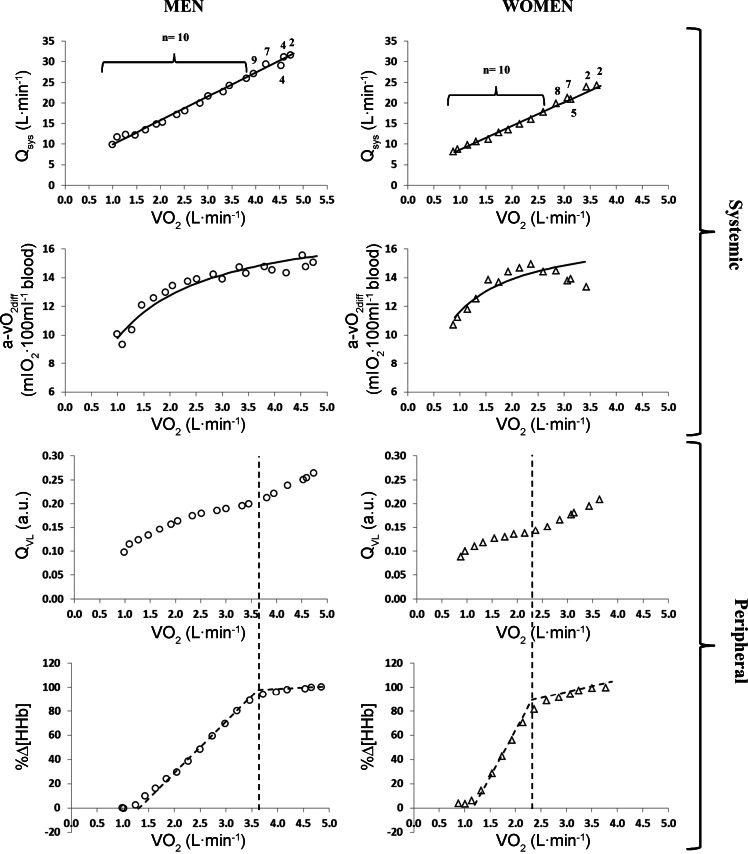
Fig. 1.
Profiles of systemic and peripheral blood flow (Qsys and QVL, respectively) and O2 extraction (a-vO2diff and %Δ[HHb], respectively) as a function of V̇o2. Left: Qsys, a-V̇o2diff, QVL, and %Δ profiles for men (open circles). Right: Qsys, a-V̇o2diff, QVL, and %Δ profiles for women (open triangles). Data points are the mean across all subjects at the given V̇o2p; model fits are the fit parameters from the mean of the fits to data in each individual. Dashed line indicates location of Δ[HHb] -BP. Numbers displayed above individual data points indicate the number of subjects from which the specific point was derived.

