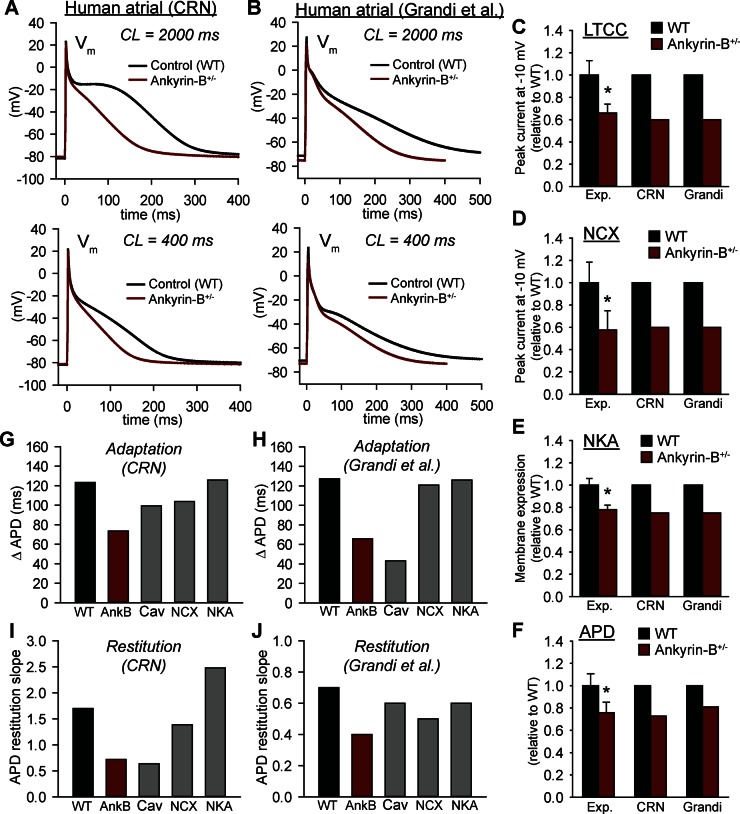
Fig. 2.
Rate dependence of action potential (AP) duration (APD) in mathematical model of ankyrin-B+/− (AnkB) atrial myocyte. A and B: 2 different models of the human atrial AP (7, 16) were used to simulate atrial APs from control (WT, black) and ankyrin-B+/− (red) myocytes during slow [cycle length (CL) = 2,000 ms] and rapid (CL = 400 ms) pacing. C–F: simulated and measured (9) L-type Ca2+ current (LTCC), Na+/Ca2+ exchanger (NCX), Na+/K+ ATPase (NKA), and APD are shown for model validation. G and H: APD adaptation for WT, ankyrin-B+/−, Cav1.3-deficient (Cav), NCX-deficient (NCX) and NKA-deficient (NKA) cells. Adaptation curves were created by pacing cell to steady state over a range of CLs. Summary data are shown as change in APD as CL decreases from 2,000 to 400 ms. I and J: slope of APD restitution curves for WT, ankyrin-B+/−, Cav1.3-deficient, NCX-deficient, and NKA-deficient cells. Restitution curves were created by applying a premature stimulus following steady-state pacing at CL of 1,000 ms, and summary data are shown as maximal slope of the curve. CRN, Courtemanche, Ramirez, and Nattel (7) model; Grandi, Grandi et al. (16) model; Exp, experiment; Vm, transmembrane potential. *P < 0.05 vs. WT.

