
Figure 5.
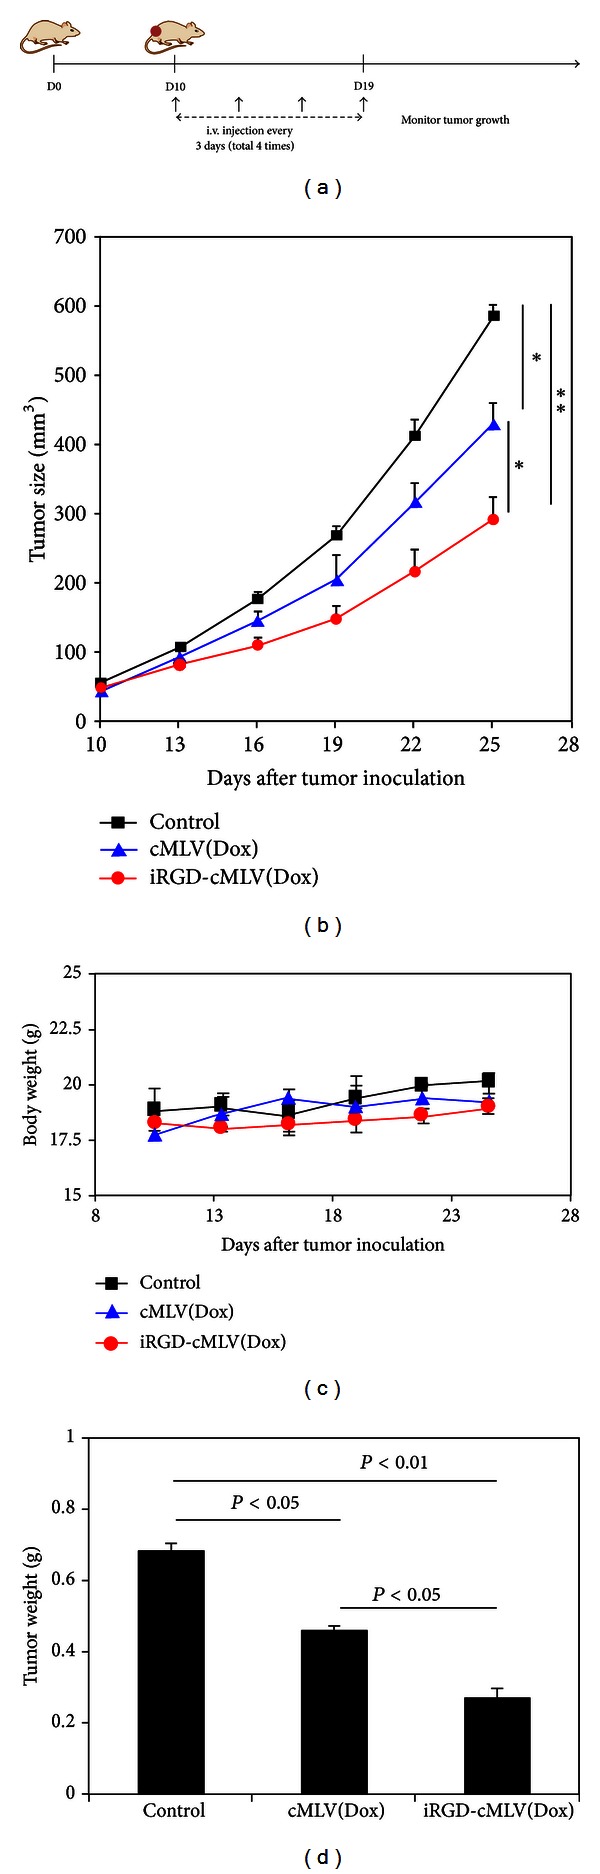
Antitumor effect of iRGD-cMLVs and cMLVs in the 4T1 breast tumor model. (a) Schematic diagram of the experimental protocol for the in vivo tumor study. (b) Tumor growth was measured after treatment without injection (control), cMLV(Dox), and iRGD-cMLV(Dox) (2 mg/kg Dox equivalents). Error bars represent standard error of the mean; n = 5 for each treatment group (*P < 0.05). (c) Average mouse weight loss over the duration of the experiment. (d) Tumor weight of excised tumors from each treatment group at 25 days after tumor inoculation. Error bars represent standard error of the mean; n = 5 for each treatment group.