
Figure 7.
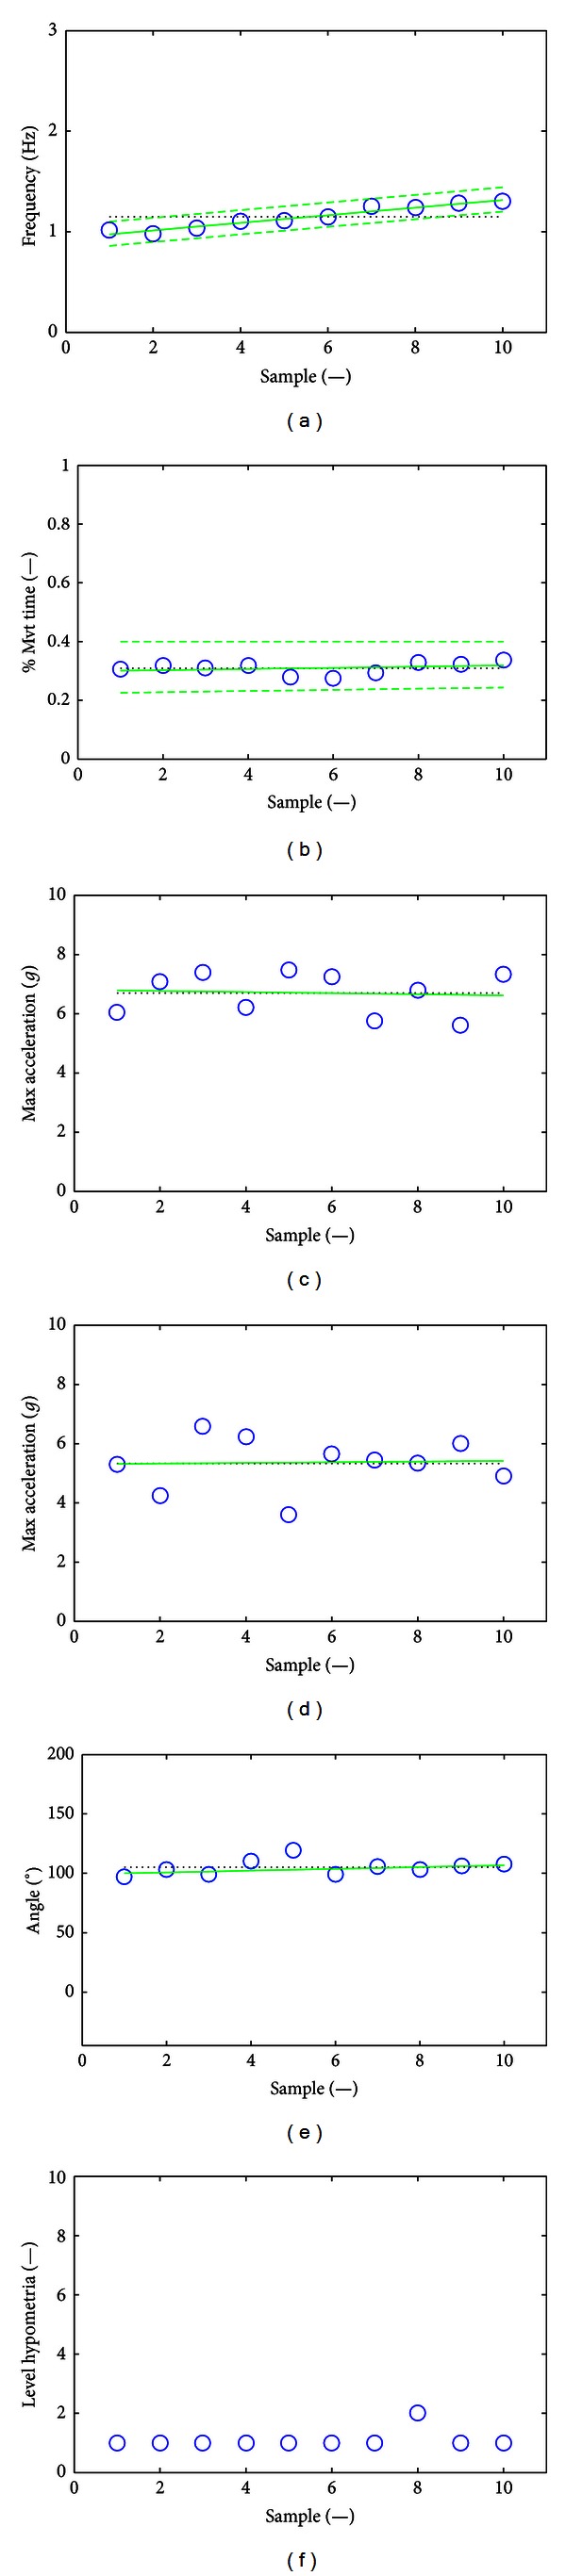
Typical features for an SMD consensus score of 0. Plot (a) gives the movement frequencies (circles). Plot (b) gives the percentages of movement time for maximum opening acceleration. Plot (c) gives the maximum closing accelerations. Plot (d) gives the maximum opening accelerations. Plot (e) gives the opening angles. Plot (f) gives the level of hypometria (circles) and the possible presence of initiation hesitations (triangles). For each plot except (f), the mean is in dotted line, the linear regression among points is in continuous line, and the limits for the detection of hesitations are in dashed lines (plots (a) and (b) only). The healthy volunteer performed repetitive FT movements at a low and slowly growing frequency and did not have any hesitations or halts. The percentage time for maximum opening acceleration is steady over samples, as maximum closing and opening accelerations. The movement amplitude is big and constant, showing no decrementing amplitude.