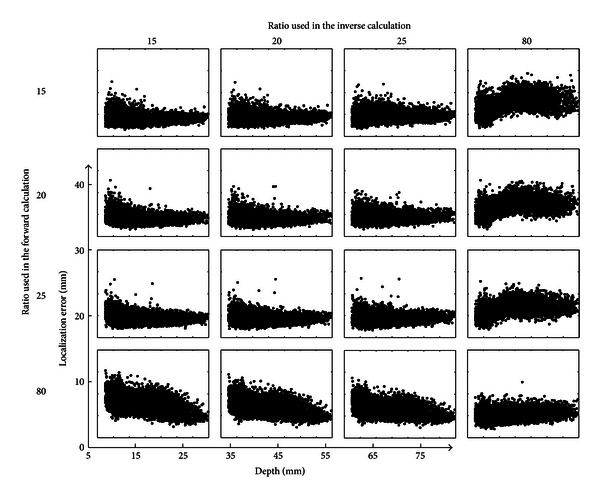
Figure 3.

Scatterplot of the dipole localization errors obtained from four different BSCRs when considering noise-contaminated EEG measurements. Rows correspond to different BSCRs used in the forward calculation, and columns correspond to different BSCRs used in the inverse calculation.
