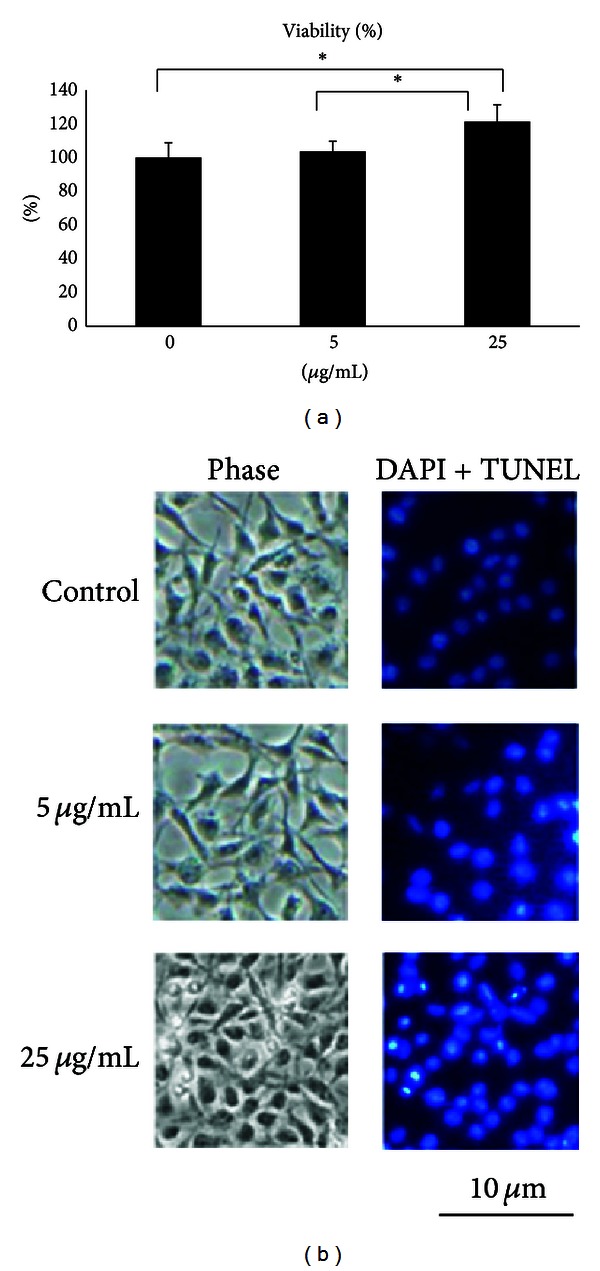
Figure 2.

(a) Quantification of viability of Schwann cells treated with ferulic acid relative to controls. Values are means ± S.E.M. *P < 0.05 indicates a significant difference from other groups. (b) Nuclei of Schwann cells characterized by DAPI and TUNEL assays and investigated via fluorescent microscopy.
