Figure 4.

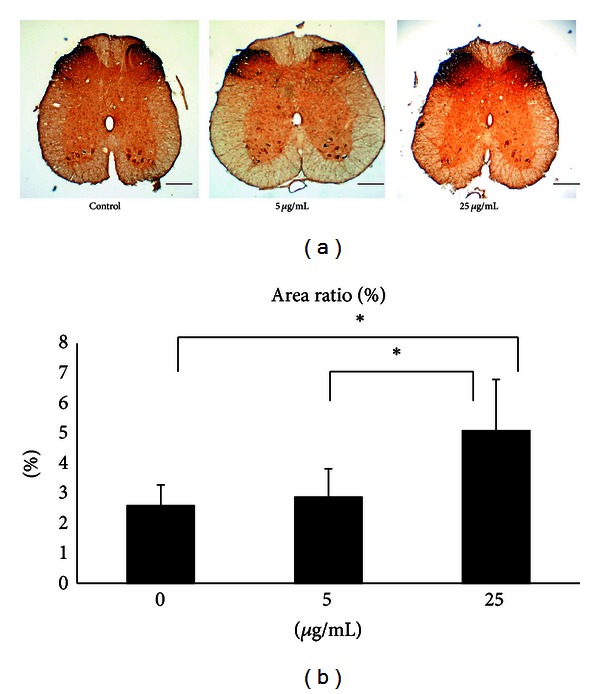
(a) Photomicrographs demonstrating CGRP-IR in dorsal horn in the lumbar spinal cord after injury of controls and FA-treated animals. Scale bars = 200 μm. (b) Note the significantly increased CGRP-IR area ratios in FA-treated animals at 25 μg/mL compared to those at 5 μg/mL and the controls. *P < 0.05 indicates significant difference from other groups.
