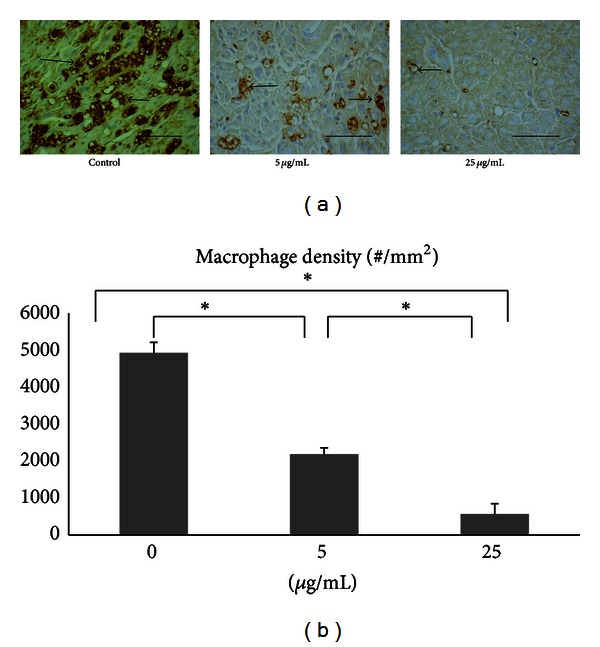
Figure 5.

(a) Photomicrographs demonstrating antirat CD68 immunoreactivity in macrophages (arrows) from cross sections of distal nerve cables of controls and FA-treated animals. Scale bars = 100 μm. (b) Note the dramatically decreased density of macrophages with the concentration of FA. *P < 0.05 indicates significant difference from other groups.
