
Figure 3.
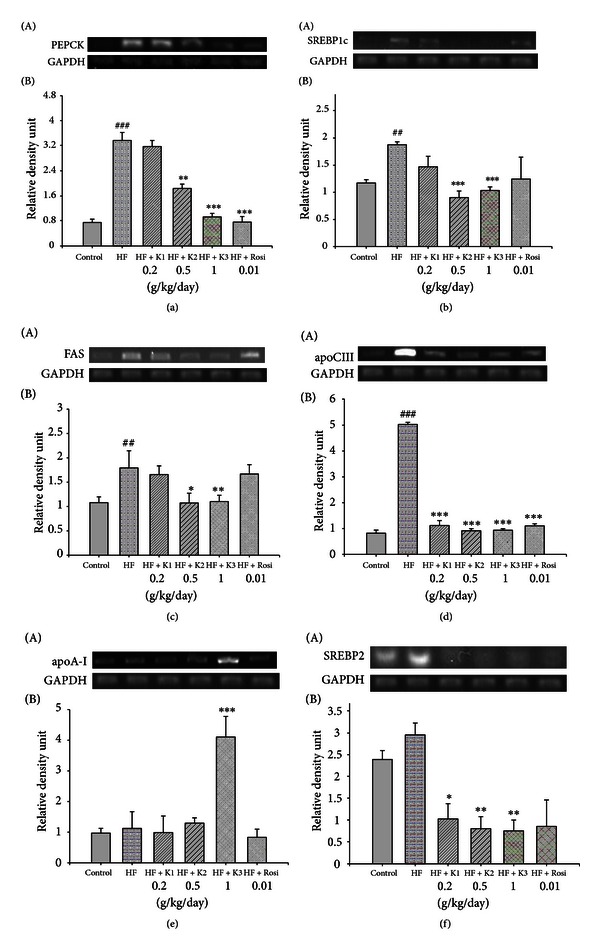
Semiquantitive RT-PCR analysis on (a) PEPCK, (b) SREBP1c, (c) FAS, (d) apo C-III, (e) apoA-I, and (f) SREBP2 mRNA expression in liver tissue of the mice by oral gavage extracts of hawthorn for 4 weeks. All values are means ± S.E. (n = 9). ## P < 0.01, ### P < 0.001 compared with the control (CON) group; *P < 0.05, **P < 0.01, ***P < 0.001 compared with the high-fat + vehicle (distilled water) (HF) group. K1, K2, K3, extracts of hawthorn.