
Figure 1.
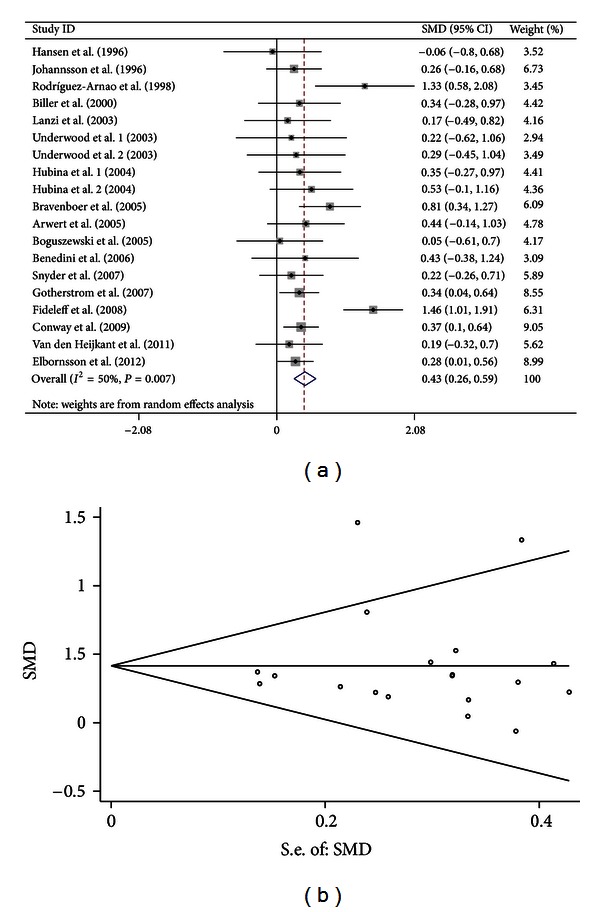
Forest plot and funnel plot for the association between GH treatment and BMD of spine. (a) Forest plot using a random effects model. (b) Funnel plot using Begg methods.
Official websites use .gov
A
.gov website belongs to an official
government organization in the United States.
Secure .gov websites use HTTPS
A lock (
) or https:// means you've safely
connected to the .gov website. Share sensitive
information only on official, secure websites.
Forest plot and funnel plot for the association between GH treatment and BMD of spine. (a) Forest plot using a random effects model. (b) Funnel plot using Begg methods.