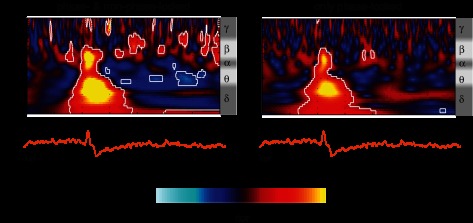
Fig. 2.

Time-frequency decomposition of the EEG responses to finger lances at Cz. Left: average of the time-frequency transforms of single trials (TF-single) revealing both phase-locked and non-phase-locked energy changes related to the stimulation. Right: time-frequency transform of the grand average of the trials (TF-group) revealing only stimulus-related changes phase-locked across subjects. Results are displayed as increases and decreases of energy (probability cumulative density function, CDF) relative to baseline (−1,000 to −500 ms). Values between 0 and 0.5 correspond to energy decreases, while values between 0.5 and 1 correspond to energy increases. Circumscribed areas represent significant energy changes relative to baseline. An approximated EEG frequency band division is displayed next to each time-frequency plot.
