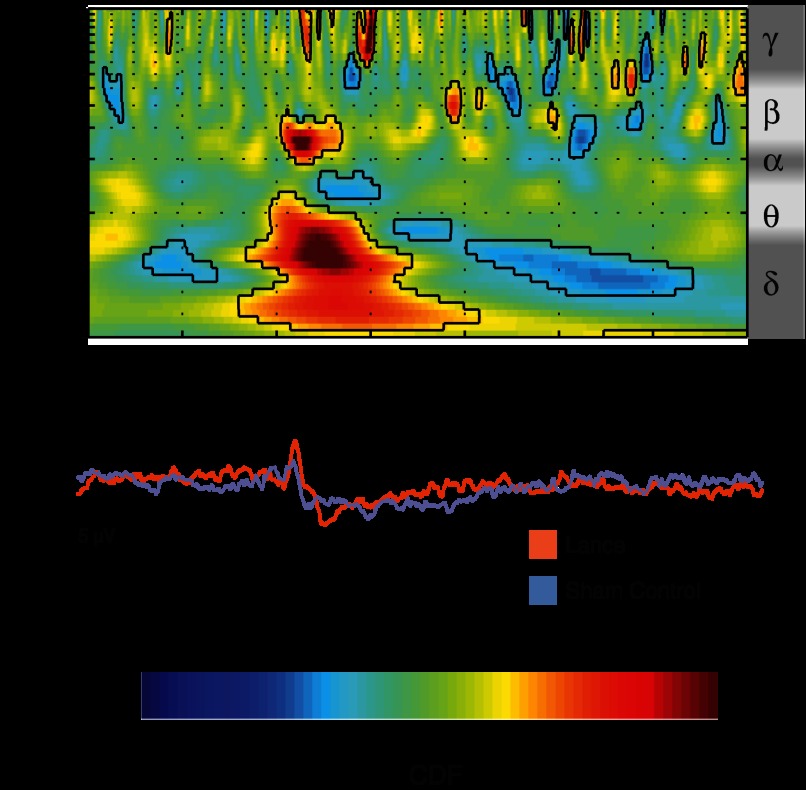
Fig. 3.
Pairwise comparison of the time-frequency decomposition between lance and sham control at Cz. This comparison displays the difference in the phase-locked and non-phase-locked evoked activity between lance and sham control. Values between 0 and 0.5 correspond to lower energy after lance, while values between 0.5 and 1 correspond to higher energy after lance (compared with sham control). Circumscribed areas represent significant evoked activity differences between lance and sham control. An approximated EEG frequency band division is displayed next to the time-frequency plot.

