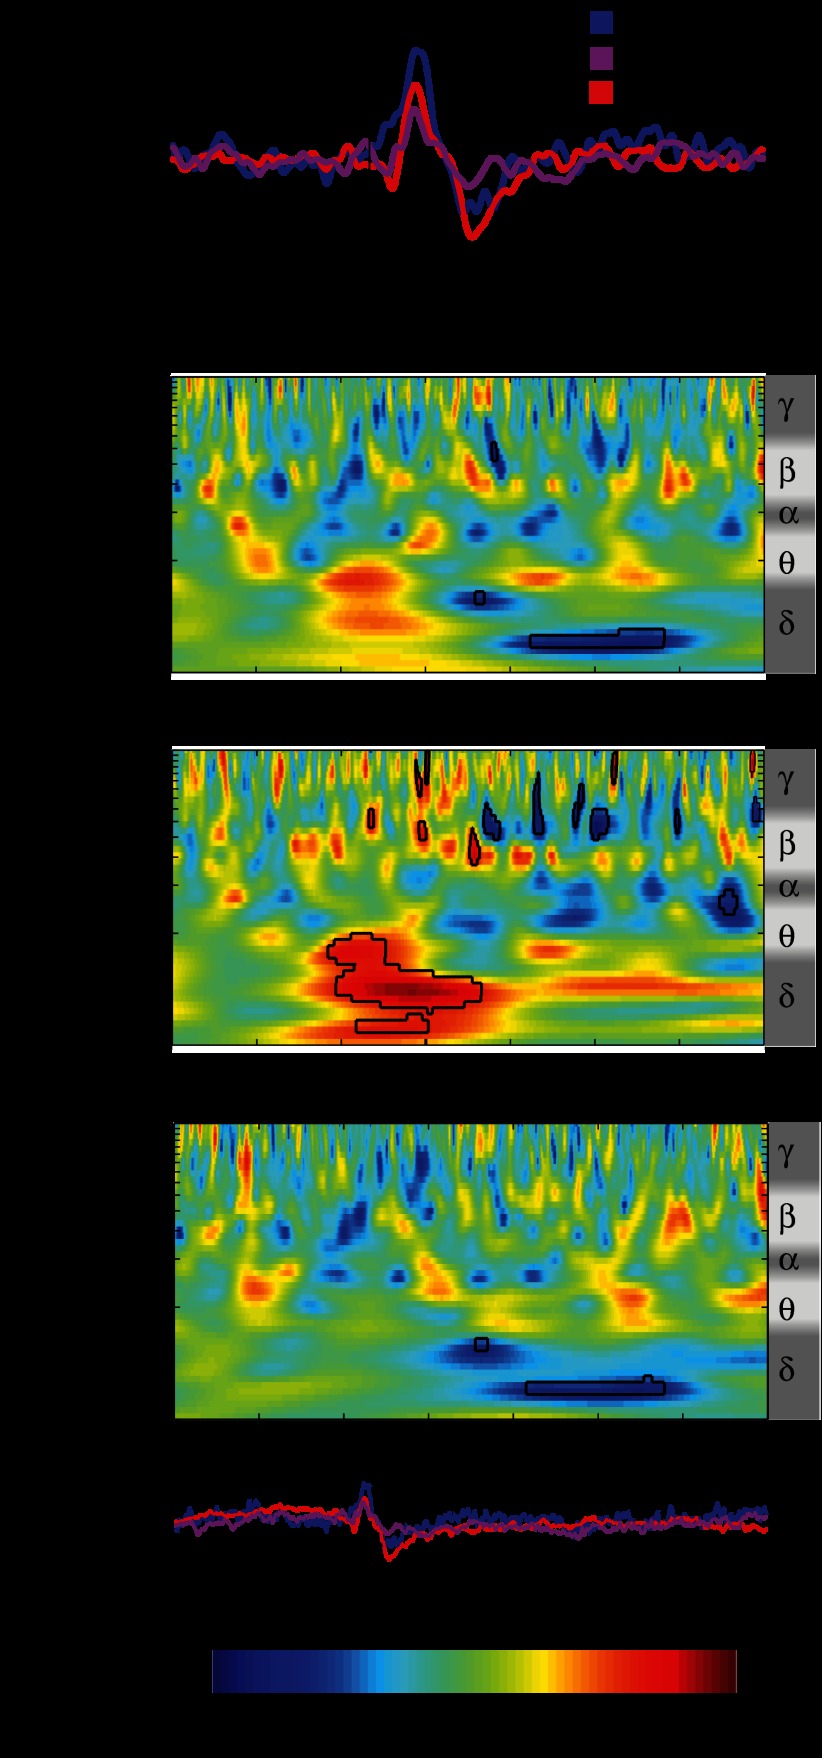
Fig. 7.
A: grand average ERP waveforms in response to lances fitting Aδ or C fiber-mediated pain description or neither of the 2 categories at Cz. B: comparison of the time-frequency decomposition between lances fitting Aδ or C fiber-mediated pain description or neither of the 2 categories at Cz. This comparison displays the difference in the phase-locked and non-phase-locked evoked activity resulting from post hoc testing. Values between 0 and 0.5 correspond to lower energy after the first term of the comparison, while values between 0.5 and 1 correspond to higher energy after the second. Circumscribed areas represent significant evoked activity differences. An approximated EEG frequency band division is displayed next to each time-frequency plot.

