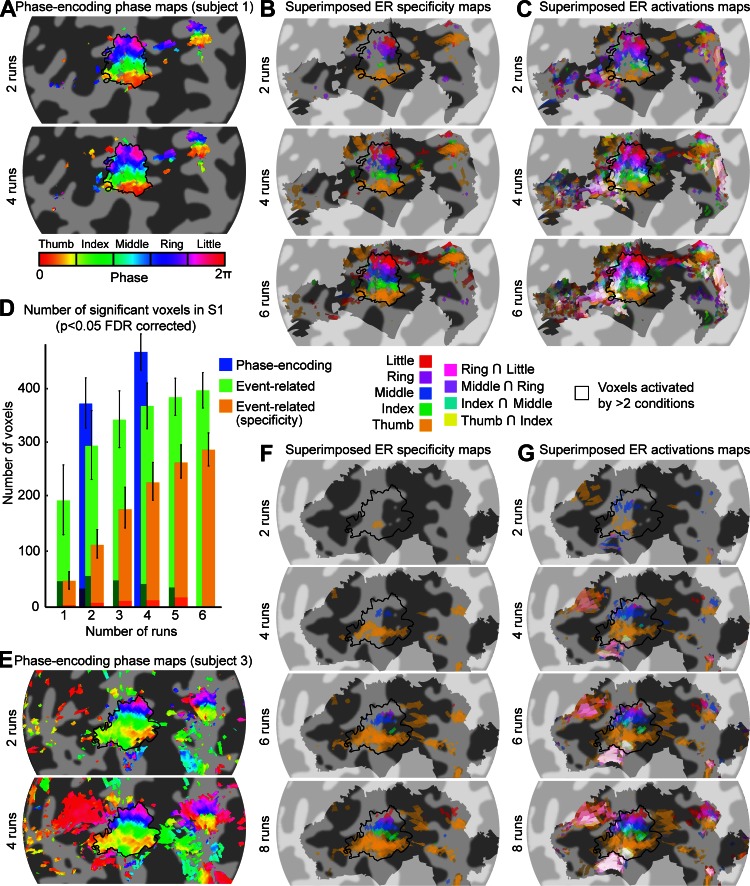
Fig. 6.
Effect of the number of scans included in the analysis. A: phase maps formed from the phase-encoding data acquired in 2 or 4 runs, thresholded at a coherence value of 0.25. Phase values (in radians) represent corresponding preferred stimulus location (fingertip). Phase values are complex-averaged across cortical depths using phase and amplitude values at each depth. Runs of the phase-encoding design were of 3-min duration for this subject. The maps constructed using 2 or 4 scans are very similar, suggesting that 2 runs (6 min) are sufficient to yield robust maps. B: superimposed fingertip specificity maps (see Fig. 3B for details) for 2, 4, and 6 runs. Runs of the ER design were 4 min long. Each addition of 2 runs improves the maps found up to 6 runs (24 min). C: same as B for superimposed activation maps (each stimulation condition compared with 0). D: number of voxels in the S1 ROI (black outline in other panels) responding significantly (P < 0.05, FDR-adjusted) to at least 1 fingertip as a function of the number of runs for each analysis [Phase-encoding, Event-related, and Event-related (specificity)] averaged across 6 subjects. Voxel count was restricted to the cortical surface. The darker shaded area at the base of each bar is the number of voxels for which the preferred fingertip was different from the preferred finger when all runs were included. Error bars indicate the standard error across 6 subjects. E: same as A for subject 3. Runs of the phase-encoding design were 3 min long for this subject. As for subject 1, somatotopic maps were very similar using 2 or 4 scans. F: same as B for subject 3. Subject 3 underwent 8 runs of the ER design. For this subject, 8 runs (32 min) were necessary to obtain a finger specificity map including all 5 fingertips. G: same as C for subject 3.

