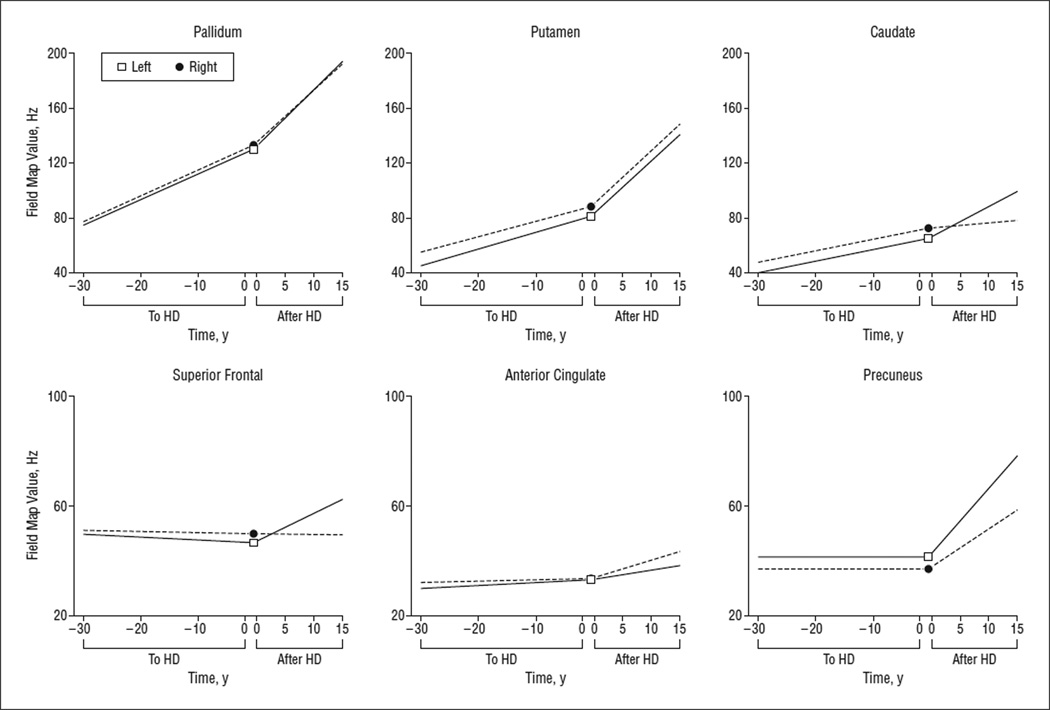
Figure 2.
Progression models. Using expected time to Huntington disease (HD) onset, we found significant increases in the rate of field map value increases in the basal ganglia in the premanifest period of Huntington disease (pre-HD); the slope was steeper after diagnosis. Cortical field map value increases were present only after diagnosis, supporting an early important role of alterations in metals in HD.

