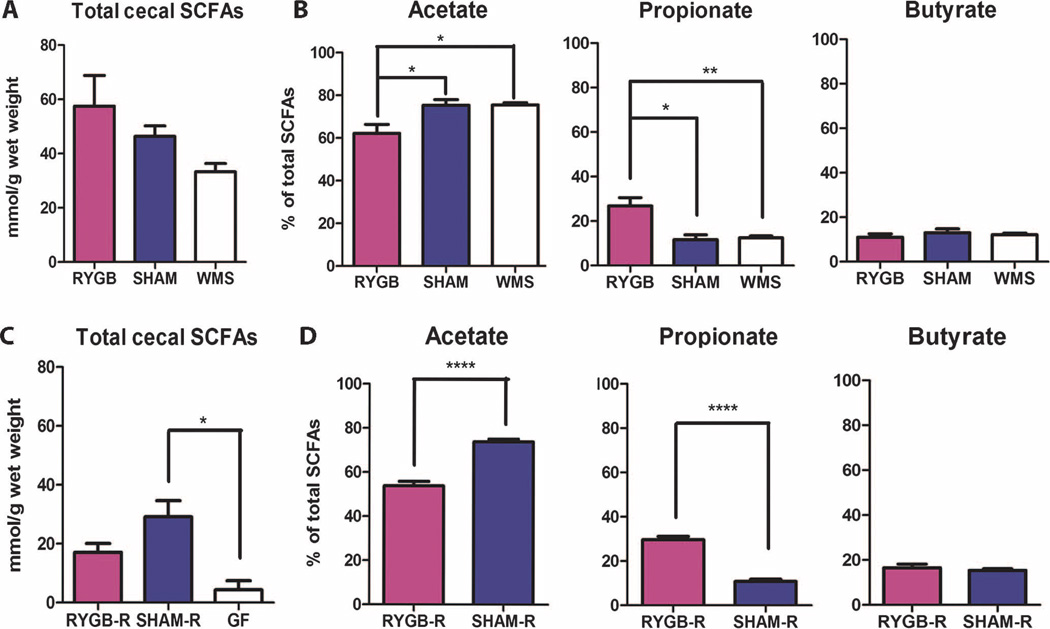
Fig. 7.
SCFA levels are consistent between donor and recipient animals. (A and B) Total cecal SCFAs (A) and percentage of total SCFAs (B) of acetate, propionate, and butyrate in RYGB-operated (n = 6), SHAM-operated (n = 4), and WMS-operated (n = 5) animals. (C) Total cecal SCFAs of RYGB-R (n = 5), SHAM-R (n = 6), and germ-free (GF; n = 4) mice 2 weeks after colonization of their respective operated donor cecal microbiota. (D) Percentage of total SCFA of acetate, propionate, and butyrate in RYGB-R and SHAM-R mice. Values represent means ± SEM. *P < 0.05, **P < 0.01, ****P < 0.001, one-way ANOVA post hoc Tukey test or Student’s t test.

