Figure 4.
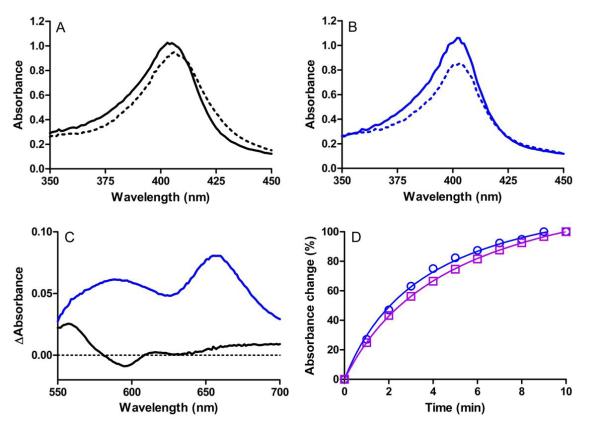
Changes in the absorption spectra of WT and Y294K MauG upon addition of a stoichiometric amount of H2O2. (A) Soret region of 3 μM WT MauG before (solid line) and immediately after (dashed line) addition of H2O2. (B) Soret region of 3 μM Y294K MauG before (solid line) and immediately after (dashed line) addition of H2O2. (C) Difference spectra (immediately after addition of H2O2 minus diferric spectra) of the higher wavelength region of the spectra for 15 μM WT MauG (black) or Y294K MauG (blue). (D). Time course for the return to the diferric state after addition of H2O2 to generate the high-valent species in Y294K MauG. The changes in absorbance were monitored at 404 nm (blue circles) and 655 nm (purple squares). All spectra were recorded in 50 mM potassium phosphate, pH 7.5, at 25 °C.

