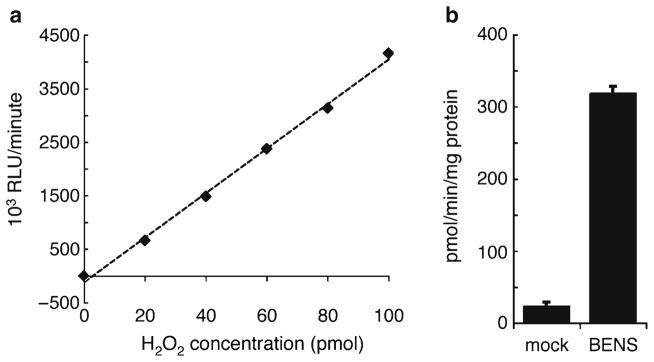
Fig. 2.

(a) Representative plot of H2O2 standard curve displaying H2O2 concentration (0–100 pmol in 300 μL reaction; x-axis) versus 103 RLU/min (y-axis). A best-fit line is also plotted (r 2 >0.99). (b) Representative data. A549 lung adenocarcinoma cells were treated for 24 h with or without 10 μM of the SMO-inducing polyamine analog, bis(ethyl)-norspermine (BENS). Cell lysate was harvested and SMO enzyme activity measured as described in this chapter.
