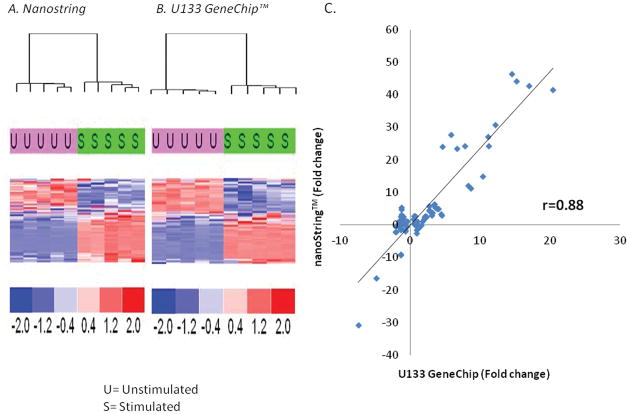
Figure 2.
Comparison of gene expression patterns and variation in human whole blood ex vivo stimulated with bacterial lipopolysaccharide. A single sample was divided and one-half stimulated with 100 ng/ml of E. coli LPS for two hours at 37° C. Total RNA was isolated from the two preparations and divided into ten equal aliquots, five analyzed by microarray, and five analyzed with the nanoString™ technology. A and B. Heat maps of the hierarchical clustering of the gene expression data for the two technologies, revealing that both methodologies easily detected the change in gene expression changes induced by LPS (U=Unstimulated samples; S=Stimulated samples) C. Pearson correlation coefficients for the change in gene expression of the 63 genes produced by the LPS stimulation. Values represent fold change over control expression values.

