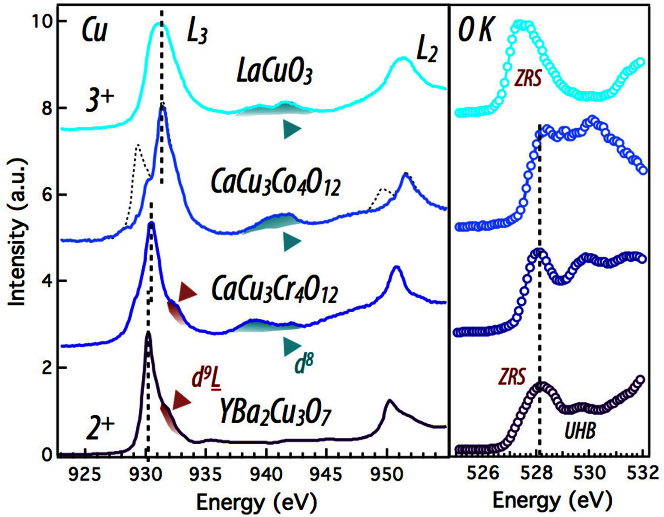
Figure 2. XAS measurements on Cu L- and O K-edges.
Left panel displays the Cu L-edge for all samples with the Zhang-Rice and d8 ground states highlighted. LCO and YBCO are shown as references for Cu 3+ and Cu 2+ respectively, highlighting the change in valence for Cu with B-site change36,37. Right panel shows the corresponding O K-edge spectra displaying the Zhang-Rice ligand hole state. In LCO, the higher energy peak around ~ 940 eV is due to the presence of the unusual Cu d8 state. In CCCoO, a previously reported impurity peak around 929 eV32 is subtracted from both the L3 and L2 edges by fitting to a Voigt function. This peak corresponds to the d9 peak observed on the other samples, however it has a very small spectral weight (~ 1/50 ratio between d9 and d9L states).

