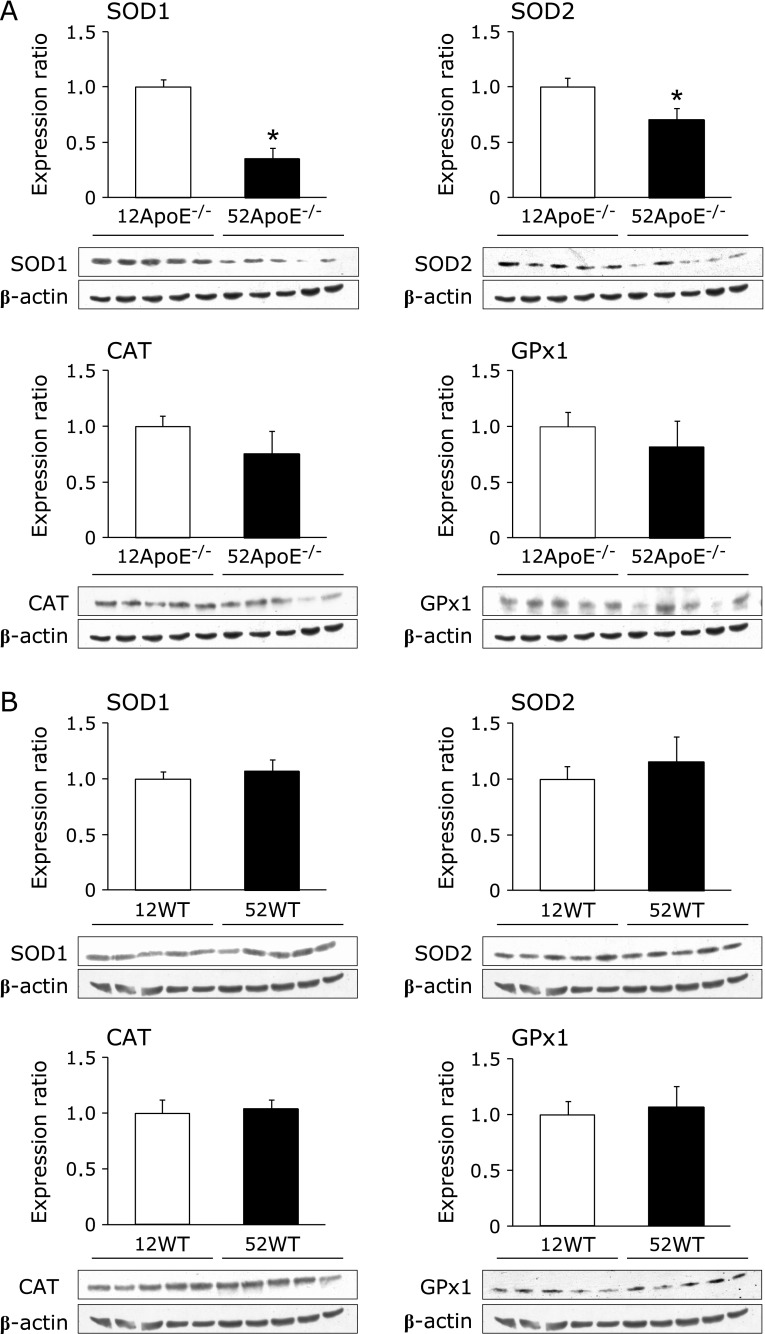
Fig. 2.
Effects of aging on expression of SOD1, SOD2, CAT and GPx1 proteins in the liver of ApoE−/− mice (A) and WT mice (B). Expression levels were measured by western blotting. The β-actin content in each sample was used to normalize the results. Upper sides represent quantitative value and bottom sides show graphic data of each enzyme. Values are means ± SE, n = 5–9. *p<0.05 (vs 12-week-old mice).

