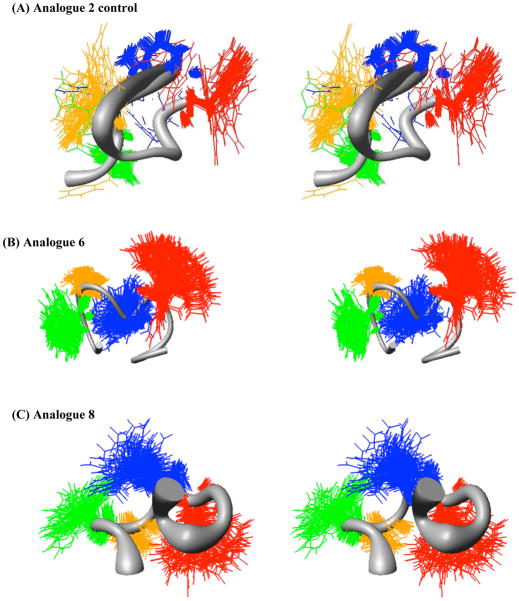
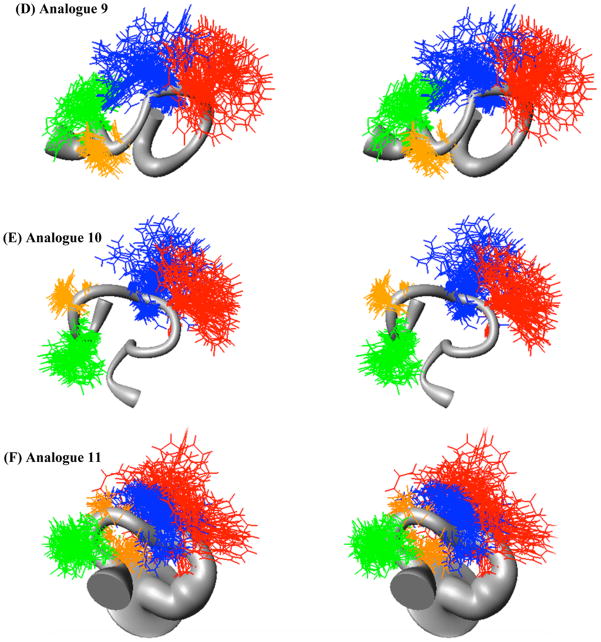
Figure 4.
Sausage stereoview representations of the representative major families members of compounds (A) control 2 (RMSD = 0.97 ± 1.01Å) (B) 6 (RMSD = 0.78 ± 0.26 Å), (C) 8 (RMSD = 1.66 ± 0.56 Å), (D) 9 (RMSD = 1.67 ± 0.53 Å), (E) 10 (RMSD = 1.08 ± 0.29 Å), and (F) 11 (RMSD = 2.84 ± 0.53 Å), aligned on the backbone heavy atoms of residues 3–7. The His side chain is indicated in green, the DPhe side chain in orange, the Arg side chain in blue, and the Trp side chain in red. A wide grey backbone indicates greater flexibility in that domain. Following restrained molecular dynamics (RMD) simulations for 10 ns, 200 equally spaced structures were energy minimized with the NMR based restraints. The energy minimized structures were grouped into conformational families by comparison of the back bone dihedral angels within the His-Phe-Arg-Trp domain. For comparative purposes, the energy ranges for each of the representative families illustrated is as follows. (A) control 2 33–110 kCals/mol, (B) 6 157–513 kCals/mol, (C) 8 208–233 kCals/mol, (D) 9 166–190 kCals/mol, (E) 10 173–197 kCals/mol, and (F) 11 196–252 kCals/mol.


